

Agency Capacity Planning: A Practical Guide for Managers
Agency capacity planning is the practice of matching your team's available billable hours to forecasted work so you protect margin, meet deadlines, and prevent burnout. If you're starting from scratch, three actions matter most right now: calculate your true billable hours per person, map every committed project for the next 4-12 weeks, and flag which roles are already overbooked.
Do those three things in the next hour:
- Pull your roster. List every team member, their weekly hours, and their FTE fraction (1.0 for full-time, 0.5 for half-time, etc.).
- Subtract non-billable time. Remove internal meetings, admin, business development, and PTO. A typical agency loses a substantial portion of gross hours to non-billable work.
- Book confirmed work first. Enter every signed contract and active retainer into your rolling window before touching pipeline.
- Run one quick metric. Divide total committed hours by total available hours. If that number exceeds 0.90, you have a bottleneck worth addressing today.
That single ratio tells you more about your agency's near-term health than any dashboard.
Key Takeaways
Effective agency capacity planning requires matching true available hours (after non-billable deductions) to committed and probable work, reviewed weekly by role, with clear ownership and hiring triggers set before overload occurs.
| Point | Details |
|---|---|
| Target utilization range | Aim for 70-80% billable utilization; a coverage ratio of 0.75-0.90 signals a healthy plan. |
| Role-level view is essential | Aggregate team utilization hides bottlenecks; always review capacity by role, not just total hours. |
| Weekly cadence is the minimum | A monthly review is too slow; a 30-minute weekly meeting with updated committed hours is the baseline. |
| Hiring trigger threshold | Open a hiring conversation when average utilization exceeds 75% for six consecutive weeks. |
| Roadbase starts with the brief | Turn a real brief into an editable draft plan and quote to review before the work is committed. |
Table of Contents
- What is agency capacity planning and who owns it?
- Capacity vs. utilization vs. workload: what's the difference?
- Why capacity planning is critical for agency margins and retention
- What goes into a capacity plan: the core inputs
- Which capacity-planning strategy fits your agency?
- How to build a working capacity plan, step by step
- A worked example and template for a 5-person team
- Metrics and KPIs to track, with exact formulas
- Tools and data sources for resource capacity planning
- Common pitfalls agencies fall into and how to avoid them
- How long does capacity planning take to implement?
- How to prioritize and allocate resources when capacity is tight
- Governance, roles, and cadence: who owns the plan?
- Change management best practices for adopting capacity planning
- How to communicate capacity plans to your team
- Integrating capacity planning with project management and sales forecasting
- Employee wellbeing and burnout indicators in capacity planning
- An operations lead's perspective on running the weekly review
- Roadbase: turn a real brief into a reviewable plan and quote
- Sources
- FAQ
What is agency capacity planning and who owns it?
Agency capacity planning is the ongoing process of forecasting how many hours your team can realistically deliver, by role and skill, and comparing that supply against the demand from confirmed and probable client work. The goal is to protect margin, maintain delivery quality, and give leadership the data to make hiring, scoping, and sales decisions with confidence.
It is worth separating this practice from three related but distinct concepts. Scheduling assigns specific people to specific tasks on a calendar. Resource allocation decides which person handles which project. Utilization tracking measures how billable hours were actually spent after the fact. Capacity planning sits upstream of all three: it tells you whether you have enough supply before you schedule, allocate, or track anything.
Ownership matters. Without a named owner, the plan drifts into a shared spreadsheet nobody updates. A practical model:
- Operations lead or agency director: owns the plan, runs the weekly review, and sets hiring triggers.
- Project managers: report committed hours per project, flag scope changes, and update forecasts weekly.
- Account owners: feed pipeline probability and expected start dates from the CRM.
A weekly 30-minute review cadence works for most agencies. Monthly is too slow to catch a bottleneck before it becomes a missed deadline.
Capacity vs. utilization vs. workload: what's the difference?
These three terms get used interchangeably, and that confusion leads to bad decisions. Here are the exact definitions and the formulas you need.
Capacity is the number of hours a person or team can deliver in a period, after subtracting non-billable time. It is your supply.
Utilization is the share of available hours that are billed or billable. It measures how efficiently you are converting capacity into revenue.
Workload is the total hours assigned to a person or team in a period. It can exceed capacity, which is how burnout starts.
The four formulas you need
| Metric | Formula | Example |
|---|---|---|
| Available hours | (Working days x daily hours) - non-billable allowance | 20 days - non-billable hours = available hours |
| Utilization rate | Billable hours divided by available hours | coverage ratio of 0.75 |
| Capacity gap | Available hours - committed hours | available hours minus committed hours shows overbooking |
| Coverage ratio | Available hours / committed hours | 128 / 140 = 0.91 |
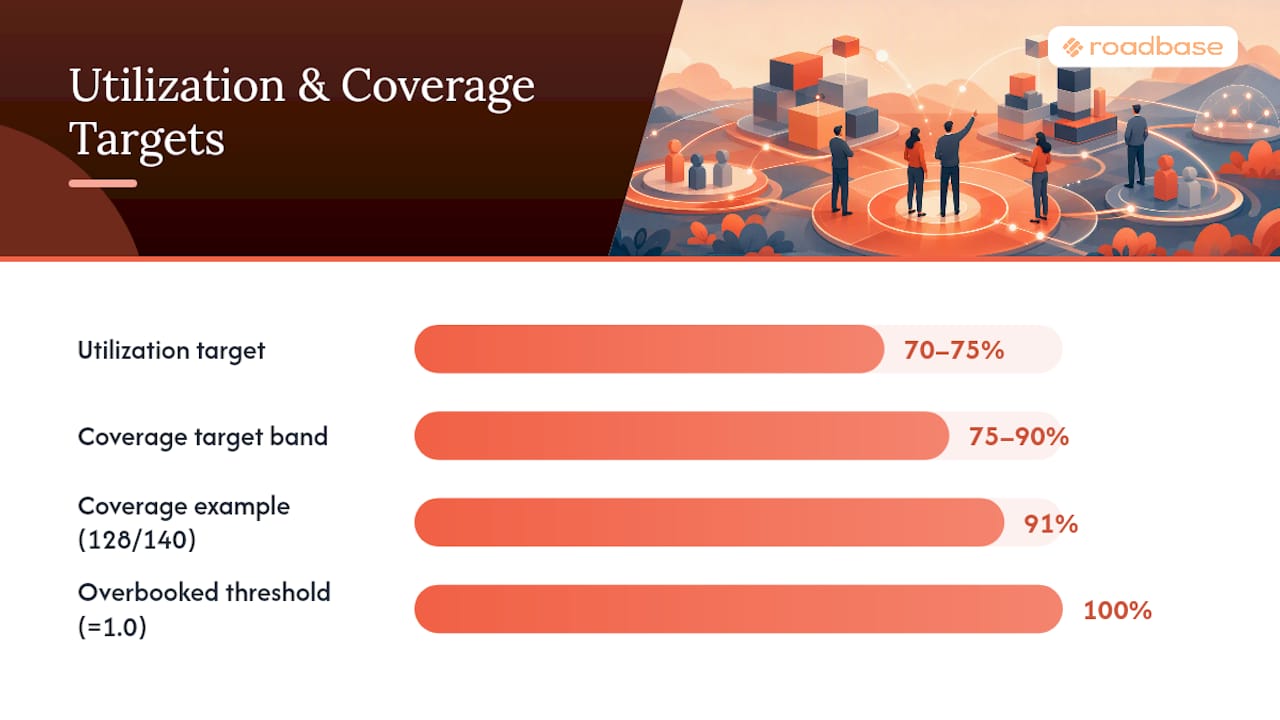
Recommended target ranges: Agency Acquisitions recommends targeting roughly 70-75% billable utilization to maintain a buffer for scope creep, internal work, and unexpected requests. Supervisible suggests a healthy coverage ratio in the 0.75-0.90 band, meaning your available hours should comfortably cover committed hours with room to spare.
A coverage ratio above 1.0 means you are overbooked. Below 0.75 means you have significant bench time, which is a margin problem of a different kind.
Why capacity planning is critical for agency margins and retention
Most agencies that struggle with profitability are not losing money on bad clients. They are losing it on projects that were scoped against theoretical capacity rather than real available hours. The impact of getting this right touches every part of the business.
- Margin protection: Overbooked teams deliver late or cut corners, triggering write-offs, rework, and discounts that erode project margin.
- Client trust: Predictable delivery builds long-term retainer relationships. Clients who experience repeated delays rarely renew.
- Delivery quality: Work produced under sustained pressure carries more errors, more revision rounds, and more PM overhead.
- Employee wellbeing: Chronic overutilization is one of the most cited drivers of agency attrition. Replacing a mid-level designer or developer typically costs several months of their salary in recruiting and ramp time.
- Scalable growth: You cannot confidently say yes to new business if you do not know whether you have the hours to deliver it.
Capacity planning changes three specific decisions: what to sell (which projects fit your current supply), when to hire (before you are already overloaded), and when to delay a project start rather than compromise delivery. Forge notes that using historical time data to normalize your forecasts makes those decisions far more reliable than gut feel.
What goes into a capacity plan: the core inputs
A usable capacity plan needs a minimum viable dataset. Missing any of these fields forces you to estimate, which compounds error across the whole plan.
| Field | Description | Notes |
|---|---|---|
| Person | Full name or ID | One row per person |
| Role | Designer, developer, PM, etc. | Use consistent role taxonomy |
| FTE fraction | 1.0, 0.5, 0.75, etc. | Normalize contractors to FTE equivalent |
| Gross weekly hours | Contracted hours per week | Before any deductions |
| Non-billable allowance | Hours reserved for admin, meetings, BD | Typically 20-30% of gross |
| Available billable hours | Gross hours - non-billable allowance | Your true supply figure |
| Committed client hours | Signed, active work booked in the period | Pull from PM tool or time tracker |
| Probable pipeline hours | Weighted by close probability | From CRM; use 50-70% probability threshold |
| Skill tags | Primary and secondary skills | Used for role-bottleneck analysis |
| Leave and holidays | PTO, public holidays, training days | Sync with HR or calendar |

Data normalization rules matter. A contractor working 20 hours per week is a 0.5 FTE. A blended role (e.g., a senior designer who also manages one account) needs hours split across both functions, or you will undercount PM capacity and overcount design capacity simultaneously.
Pro Tip: Before building your first plan, run a two-week time-tracking audit. Ask every team member to log hours by project and category (billable, internal, admin). The non-billable percentage you find will almost always be higher than your current assumption, and that gap is where your capacity model has been wrong.
Which capacity-planning strategy fits your agency?
There are three core strategies, and the right choice depends on how predictable your pipeline is.
Lead strategy: You hire or bench freelancers ahead of confirmed demand, betting that work will materialize. This suits agencies with strong retainer bases and reliable sales pipelines. The upside is fast delivery and the ability to take on large wins without scrambling. The downside is bench cost when deals slip or close late.
Lag strategy: You wait until work is confirmed before adding capacity. This protects margin in volatile markets but creates delivery delays and staff stress when a large project lands suddenly. It works best for agencies with long lead times between sale and project start.
Match strategy: You adjust capacity in near real-time, using a freelancer bench to flex up and down around a stable core team. Most agencies land here by default, but the best ones do it deliberately, with a pre-vetted bench and clear trigger thresholds.

| Strategy | Best for | Hiring risk | Delivery risk | Margin risk |
|---|---|---|---|---|
| Lead | Stable retainer agencies | High (bench cost) | Low | Medium |
| Lag | Project-based, long lead times | Low | High | Low |
| Match | Mixed retainer + project | Medium | Medium | Medium |
For agencies with volatile pipelines, a match strategy with a freelancer bench is the most practical starting point. Agency Acquisitions recommends triggering a hiring conversation when average utilization exceeds 75% for six consecutive weeks, rather than reacting to a single overloaded sprint.
How to build a working capacity plan, step by step
This is the operational sequence. Follow it in order the first time; once it is running, the weekly review only updates steps 3-5.
- Collect your roster data. Pull every team member's contracted hours, FTE fraction, role, and skill tags. Include contractors and part-timers.
- Calculate true available hours. Subtract non-billable allowances and any confirmed leave for the planning window. Forge recommends using historical time data to set your non-billable percentage rather than guessing.
- Book confirmed work. Enter every signed contract, active retainer, and committed project into the plan. Assign hours by role, not just by project total.
- Layer in probable pipeline. Add weighted hours from deals at 50%+ close probability. Flag which roles those deals require.
- Run scenario models. Ask three questions: What happens if your largest open deal closes next week? What if a key person takes two weeks of unplanned leave? What if a current project scopes up by 20%?
- Identify bottlenecks. Look for roles where committed plus probable hours exceed available hours. These are your hiring or subcontracting triggers.
- Set your review cadence. Lock in a weekly 30-minute review. Update committed hours, refresh pipeline probabilities, and re-run the gap calculation.
Decision checklist for common forks:
- Committed hours exceed available hours by more than 10%: consider contracting before hiring.
- A single role is bottlenecked but others have slack: explore cross-training or task redistribution.
- Pipeline is strong but no confirmed work: delay hiring; expand freelancer bench instead.
- Utilization has exceeded 80% for four or more weeks: open a hiring conversation now, not after the next overrun.
Pro Tip: Model a "sudden large win" scenario before you need it. When the win arrives, you execute a plan rather than improvise one.
A worked example and template for a 5-person team
Here is a concrete calculation for a five-person creative team over a four-week period.
Step 1: Available hours
Step 2: Committed hours by role
Alex: 110 hrs committed. Jordan: 130 hrs committed. Sam: 80 hrs committed. Riley: 90 hrs committed. Casey: 70 hrs committed. Team total: 480 hrs committed.
Step 3: Capacity gap and coverage ratio
- Capacity gap: 486 - 480 = +6 hours (marginally positive at team level)
- Coverage ratio: 486 / 480 = 1.01
The team looks fine in aggregate, but Jordan is overbooked by 10 hours and Casey is overbooked by 10 hours. Alex has 10 hours of slack. That role-level view is what aggregate numbers hide.
Template column headings for your spreadsheet or PSA import:
Person | Role | FTE | Gross hours | Non-billable % | Available hours | Committed hours | Probable hours | Capacity gap | Coverage ratio | Skill tags | Leave days
Pro Tip: Export this template as a CSV and import it into your PSA or project management tool. Most platforms accept a flat CSV with these columns. Keeping one canonical source of truth prevents the version-control problems that plague multi-tab spreadsheets.
For agencies estimating complex technical scopes, Roadbase's guidance on software integration estimates covers how to break down hours by phase and role for projects where the scope is genuinely uncertain at the brief stage.
Metrics and KPIs to track, with exact formulas
| KPI | Formula | Target range | Red-flag threshold | Operational trigger |
|---|---|---|---|---|
| Utilization rate | Billable hours divided by available hours | 70-80% | >85% sustained | Open hiring or bench conversation |
| Capacity gap | Available hrs - committed hrs | Positive | Negative for >2 weeks | Reprioritize or contract |
| Coverage ratio | Available hrs / committed hrs | 0.75-0.90 | <0.75 or >1.0 | Investigate bench time or overload |
| Forecast accuracy | Actual hours divided by estimated hours | 90-110% | <80% or >-% | Audit estimation process |
| Bench rate | Unbilled available hours divided by available hours | 20-30% | significant share | Review pipeline or pricing |
| Average ramp time | Days from hire start to full billable output | Varies by role | >90 days | Adjust hiring lead time |
Track these weekly for utilization, capacity gap, and coverage ratio. Forecast accuracy and bench rate are meaningful on a monthly or quarterly basis. Ramp time is a trailing metric you review when evaluating hiring decisions.
Tools and data sources for resource capacity planning
No single tool does everything. A practical stack pulls data from four sources and feeds it into one planning view.
| Data source | What it provides | Sync frequency |
|---|---|---|
| Time-tracking tool | Actual billable and non-billable hours by person and project | Weekly |
| PSA / resource-planning platform | Booked hours, project phases, role assignments | Daily or real-time |
| CRM / pipeline tool | Deal stage, probability, expected start date, estimated scope | Weekly |
| Finance / billing system | Invoiced hours, write-offs, margin by project | Monthly |
What to look for in a capacity-capable PSA: role-level booking (not just project-level), a forward-looking availability view by week, scenario modeling, and export to CSV or integration with your time-tracking tool. The Roadbase vs. ClickUp comparison is useful companion reading when you are separating quote preparation from work-management decisions.
For agencies that want to connect client reporting signals to capacity decisions, MYCONTENTLAB provides reporting dashboards that surface content workload and delivery status, which can feed directly into your weekly capacity review.
Where Roadbase fits in this stack: If a real client brief is still scattered across notes or a PDF, Roadbase can turn it into an editable draft of phases, tasks, roles, estimated hours, timing, and estimate reasoning. Review and adjust that work breakdown, then review the costs and quote before exporting a proposal.
Pro Tip: The biggest time sink in capacity planning is not the math; it's chasing data. Automate two feeds before anything else: a weekly export of logged hours from your time tracker and a weekly CRM export of open deals with probability and estimated scope. Everything else can be manual at first.
Common pitfalls agencies fall into and how to avoid them
Planning to theoretical maximum. If you assume 40 billable hours per person per week, your plan is wrong before you start. Always subtract non-billable time first. Recovery: Run a two-week time audit and use the real non-billable percentage going forward.
Relying on stale time-tracking data. A capacity plan built on time data that is two weeks old is a plan built on a different project state. Recovery: Set a hard weekly deadline for time entry (Friday at 5 PM) and enforce it before the Monday review.
Recovery: Always view capacity at the role level, not just the team level.
Selling to overused roles. Account owners who do not see the capacity plan will keep selling work that lands on the same two people. Recovery: Share a simplified capacity view with account owners before they close deals. A one-page role-availability summary is enough.
Overlooking non-billable time. Internal projects, proposals, training, and all-hands meetings consume real hours that do not appear in client bookings. Recovery: Create a dedicated "internal" project in your time tracker and require logging against it.
Red-flag checklist for a failing capacity process:
- Projects consistently start late without a clear reason.
- Scope renegotiations happen on more than one in three projects.
- Utilization has been above 85% for more than six weeks.
- Team members regularly report working evenings or weekends to meet deadlines.
- The capacity plan is updated less than once per week.
Pro Tip: Add a "capacity health" column to your weekly project status report. A simple red/amber/green rating per role takes 10 minutes to update and gives leadership an instant view of where the pressure is building.
How long does capacity planning take to implement?
Realistic timelines and cost factors vary by agency size and current data maturity.
| Stage | Timeline | Key activities | Rough cost factors |
|---|---|---|---|
| Quick start | 1-2 weeks | Build roster, calculate available hours, run first rolling forecast | Staff time only (several hours) |
| Full rollout | 4-12 weeks | Integrate time-tracking and CRM data, establish weekly cadence, train PMs | Tool subscriptions + 20-40 hrs PM/ops time |
| Cultural embedding | 3-6 months | Consistent weekly reviews, scenario modeling, hiring-trigger discipline | Ongoing ops overhead; possible consultant hours |
How to stage the investment: Start with a spreadsheet and real data for four weeks. Prove the value by catching one bottleneck before it becomes a missed deadline. Then invest in tooling and governance. Buying a PSA before you have clean data is a common and expensive mistake.
Pro Tip: Run a four-week sprint with a single operations lead owning the plan. At the end of the sprint, present the capacity gap data to leadership with a before/after comparison of how projects were staffed. That evidence is more persuasive than any tool demo.
How to prioritize and allocate resources when capacity is tight
When available hours are scarce, the order in which you assign them determines your margin and your client relationships. A practical prioritization hierarchy:
- Contractual commitments first. Retainers and signed contracts with delivery dates are non-negotiable. Book these before anything else.
- High-margin, high-strategic-value projects second. Not all revenue is equal. A project with 40% margin deserves priority over one at 15%.
- Pipeline work with imminent close dates third. If a deal is closing in two weeks and requires a role that is already at 80%, you need to know now, not after the contract is signed.
- Internal and business development work last. These matter, but they flex when client demand spikes.
When two client projects compete for the same role, escalate to the account owner and the client, not just the PM. Clients who understand the constraint early are far more forgiving than clients who find out at the deadline.
For small agencies exploring lightweight task allocation tools, Seven offers a simple task and CRM setup that can help feed role assignments into a basic capacity plan without the overhead of a full PSA.
Governance, roles, and cadence: who owns the plan?
A capacity plan without governance is a spreadsheet that gets ignored. Clear ownership and a fixed review rhythm are what make the difference between a plan that drives decisions and one that collects dust.
Recommended role responsibilities:
- Operations lead or COO: owns the plan, sets hiring triggers, escalates bottlenecks to leadership.
- Project managers: update committed hours weekly, flag scope changes within 24 hours of learning about them.
- Account managers: share pipeline updates every Monday, including probability shifts and expected start dates.
- Finance lead: reviews margin-by-project monthly and flags projects where actual hours are tracking above estimate.
Weekly review agenda (30 minutes):
- Review last week's utilization by role (5 minutes).
- Update committed hours for the next four weeks (10 minutes).
- Refresh pipeline probabilities and add probable hours (5 minutes).
- Flag bottlenecks and agree on actions (5 minutes).
- Note any hiring or bench decisions triggered (5 minutes).
PMI's Talent Triangle framework highlights that effective project governance requires a blend of technical, leadership, and strategic skills, which is exactly the mix a good capacity review demands from the people running it.
Change management best practices for adopting capacity planning
The process itself is straightforward. Getting people to follow it consistently is the hard part.
The most common failure mode is treating capacity planning as an ops-team exercise that PMs and account owners do not need to participate in. When PMs see the plan as extra admin rather than a tool that protects them from overload, data quality degrades within weeks.
Three practices that accelerate adoption:
Tie the plan to decisions people already care about. Show PMs that the capacity data is what triggers the conversation about adding a contractor before they are already drowning. Show account owners that it is what lets them say yes to a new client with confidence.
Start with a small, visible win. Pick one bottleneck the plan reveals in the first four weeks and resolve it visibly. When the team sees the plan catch a problem before it became a crisis, buy-in follows naturally.
Make data entry as light as possible. If updating the plan takes more than 15 minutes per person per week, it will not happen consistently. Automate what you can; keep manual inputs to the minimum viable set.
How to communicate capacity plans to your team
Transparency about capacity is one of the most underused tools in agency management. Teams that understand the plan make better decisions at the task level without needing constant escalation.
A few communication principles that work in practice:
Share a simplified view, not the full model. Most team members do not need to see the full capacity spreadsheet. A weekly one-page summary showing each role's utilization status (green/amber/red) is enough to prompt the right conversations.
Separate the "what" from the "why" in client conversations. When you need to delay a project start, tell the client the revised date and your plan to deliver on it. You do not need to explain your internal capacity model. A clear, confident delivery date is more reassuring than a detailed explanation of your staffing constraints.
For teams exploring AI-assisted task breakdown to improve the accuracy of their hour estimates, this roundup of AI task-breakdown tools covers options that can help convert briefs into structured task lists before they enter the capacity plan.
Integrating capacity planning with project management and sales forecasting
A capacity plan that lives in isolation from your PM tool and CRM is a plan you will always be updating manually. The goal is a lightweight data loop: CRM feeds probable demand, PM tool feeds committed hours, time tracker feeds actuals, and the capacity plan synthesizes all three.
The integration points that matter most:
- CRM to capacity plan: Deal stage, estimated project size (in hours or dollars), expected start date, and required roles. Update weekly. Even a manual export works at first.
- PM tool to capacity plan: Booked hours by role and project, phase start and end dates, and any scope change flags. This is your committed-hours source.
- Time tracker to capacity plan: Actual hours logged by person and project. Use this to calculate real utilization and to calibrate your non-billable percentage over time.
- Capacity plan to sales: A simplified availability view by role and week, shared with account owners before they close deals. This prevents the most common cause of overload: selling work to roles that are already at capacity.
The Roadbase vs. ClickUp comparison covers how a quoting-first tool like Roadbase differs from a work-management platform, which is a useful frame when deciding how to connect your estimation workflow to your scheduling and capacity tools.
Employee wellbeing and burnout indicators in capacity planning
Capacity data is one of the earliest warning systems for burnout, but only if you know what to look for. But there are subtler indicators worth tracking.
Behavioral signals to watch:
- Time entries submitted late or in bulk at the end of the week (a sign of disengagement or overload).
- Revision rounds increasing on projects that previously ran cleanly.
- PMs flagging scope creep more frequently than usual.
- Vacation requests being deferred or declined repeatedly.
Structural signals in the capacity data:
- One or two roles consistently carrying the team's overload while others have slack.
- Non-billable hours shrinking below 15% (people are skipping internal work to keep up with client demands).
- Bench rate dropping below 10% for more than a month.
The connection between sustained overutilization and attrition is well-established in agency operations. Replacing a mid-level team member disrupts active projects, adds recruiting and onboarding costs, and reduces the quality of work during the transition period. Catching the utilization signal early and acting on it, whether by contracting, reprioritizing, or delaying a project start, is almost always cheaper than the alternative.
An operations lead's perspective on running the weekly review
Running a weekly capacity review sounds straightforward until you are the one chasing five PMs for updated hours on a Monday morning. Here is what actually works.
One-page checklist for the operations lead:
- [ ] Confirm all time entries are submitted for the prior week by 9 AM Monday.
- [ ] Export committed hours from PM tool.
- [ ] Pull pipeline updates from CRM (deals at 50%+ probability).
- [ ] Update available hours for any leave or holidays in the next four weeks.
- [ ] Recalculate utilization, capacity gap, and coverage ratio by role.
- [ ] Flag any role above 85% utilization or below 0.75 coverage ratio.
- [ ] Prepare a one-page summary for the review meeting.
15-minute weekly review agenda:
- Utilization by role: red/amber/green status (3 minutes).
- Committed hours update: any new bookings or scope changes (5 minutes).
- Pipeline refresh: deals moving to 50%+ probability (3 minutes).
- Bottleneck actions: who owns each resolution (4 minutes).
Sample script lines:
Requesting data from a PM: "Can you update your committed hours in the plan by Monday at 9 AM? I need the role-level breakdown, not just the project total."
Explaining a delayed start to a client: "We want to give this project the full attention it deserves. Our current team availability means we can start on [date], and we'll have [deliverable] to you by [date]."
Based on our current pipeline, that trend continues for at least eight more weeks. Here is what adding one contractor now would cost versus the margin risk of continuing to overbook."
Roadbase: turn a real brief into a reviewable plan and quote
If a real client brief is still scattered across notes or a PDF, Roadbase gives you a practical place to turn it into an editable draft plan and quote.
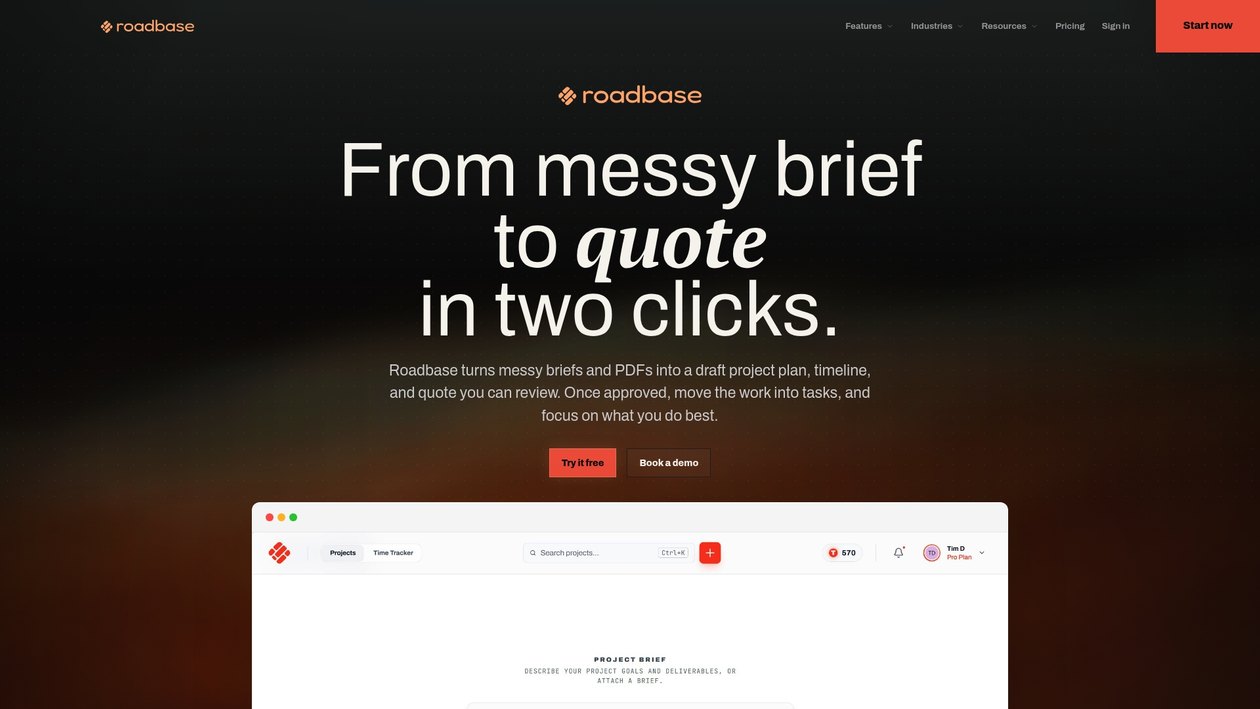
Paste the brief or attach a PDF, then generate a first draft of phases, tasks, roles, estimated hours, timing, and estimate reasoning. Review and adjust it before you use it as the project plan and quote.
Review the labor, overhead, direct costs, contingency, and target margin behind the quote, then export the reviewed plan as a proposal PDF. Once the quote is approved, keep the work connected to simple task statuses, track time against tasks, and compare that time with the estimate.
Start a free trial at Roadbase to turn a real brief into an editable plan and quote you can review.
Sources
- PMI: PMI Talent Triangle - the key to project management success
- Agency Capacity Planning: How to Deliver More Without Burning Out Your Team
- Agency Capacity Planning: How to Match Work to Your Team | Forge
- Agency Capacity Planning: Your 2026 Guide | Supervisible
FAQ
What are the three types of capacity planning?
The three core strategies are lead (hiring ahead of confirmed demand), lag (adding capacity only after demand is confirmed), and match (flexing capacity in near real-time using a freelancer bench). Most agencies use a match strategy with a pre-vetted contractor bench to balance cost and delivery risk.
What is an example of capacity planning for an agency?
A five-person team with 486 available billable hours in a four-week period has 480 hours of committed client work, giving a coverage ratio of 1.01. At the role level, the developer is overbooked by 10 hours, which triggers a conversation about contracting before the project starts rather than after a deadline is missed.
What are the steps of capacity planning?
The core steps are: collect roster data, calculate true available hours by subtracting non-billable time, book confirmed work by role, layer in probable pipeline hours, run scenario models for key risks, identify role bottlenecks, and review weekly. Forge recommends using historical time data at step two to make the available-hours figure accurate.
What is the best tool for capacity planning?
The right tool depends on your agency's size and data maturity. A spreadsheet works for the first four weeks while you establish clean data. A PSA with role-level booking and a forward availability view is the next step. For the separate quote-preparation step, Roadbase can turn a real brief into an editable draft of the work breakdown and quote for review; after approval, tracked time can be compared with the estimate.
When should an agency hire based on capacity data?
Agency Acquisitions recommends opening a hiring conversation when average utilization for a role exceeds 75% for six consecutive weeks. At that point, the pipeline data should also show that demand will continue, making the hire a data-backed decision rather than a reactive one.