

Reference Class Forecasting: Estimate From Past Projects
Reference class forecasting means estimating a new project by looking at how similar finished projects actually turned out, instead of relying only on the plan in front of you. For a freelancer or agency, the reference class is your own history: the last several projects of the same type, their estimated hours and their tracked hours. The gap between the two gives you a historical check on your next quote. If you track actuals against estimates, Roadbase puts that comparison in the same place you build your next estimate.
TL;DR
- Reference class forecasting is the "outside view": you forecast from how comparable past projects performed, not from the story of the project in front of you.
- Pick a class of finished projects that are similar in type and scale, record estimated versus actual, and find your typical overrun ratio.
- Check your bottom-up estimate against that ratio, avoiding an extra uplift if it already includes comparable allowances. Document any adjustment.
- Guidance for large public projects suggests at least 10 comparable projects. Freelancers can use three to five for a provisional exercise, not a reliable probability forecast.
- The method only works if you record actuals every time, including the projects that went badly.
Table of Contents
- What reference class forecasting is
- Inside view versus outside view
- Does it actually work?
- The three steps, applied to creative work
- A worked example
- Real examples of the method
- Building a class from your own projects
- Where the method needs care
- How Roadbase supports the routine
- Start with your own numbers
- Our perspective
- FAQ
- Sources
What reference class forecasting is
The method comes from the work of psychologists Daniel Kahneman and Amos Tversky on the planning fallacy, and was brought into project management by Bent Flyvbjerg. Flyvbjerg's paper describes it as a way to predict a project's outcome from the actual performance of a reference class of comparable projects. You identify the class, establish how its outcomes were distributed, and place your project within that distribution.
A "reference class" is simply a group of past projects that resemble the one you are quoting. A "distribution" is the spread of results in that group: some came in close to estimate, some ran 20% over, one ran 60% over. The distribution shows the historical spread and helps inform a forecast. Its relevance depends on how well the past projects match the new one.
The forecast does not require you to imagine every event that could go wrong. That outside view can counter optimism, though it still depends on an honest choice of comparable projects.
Inside view versus outside view
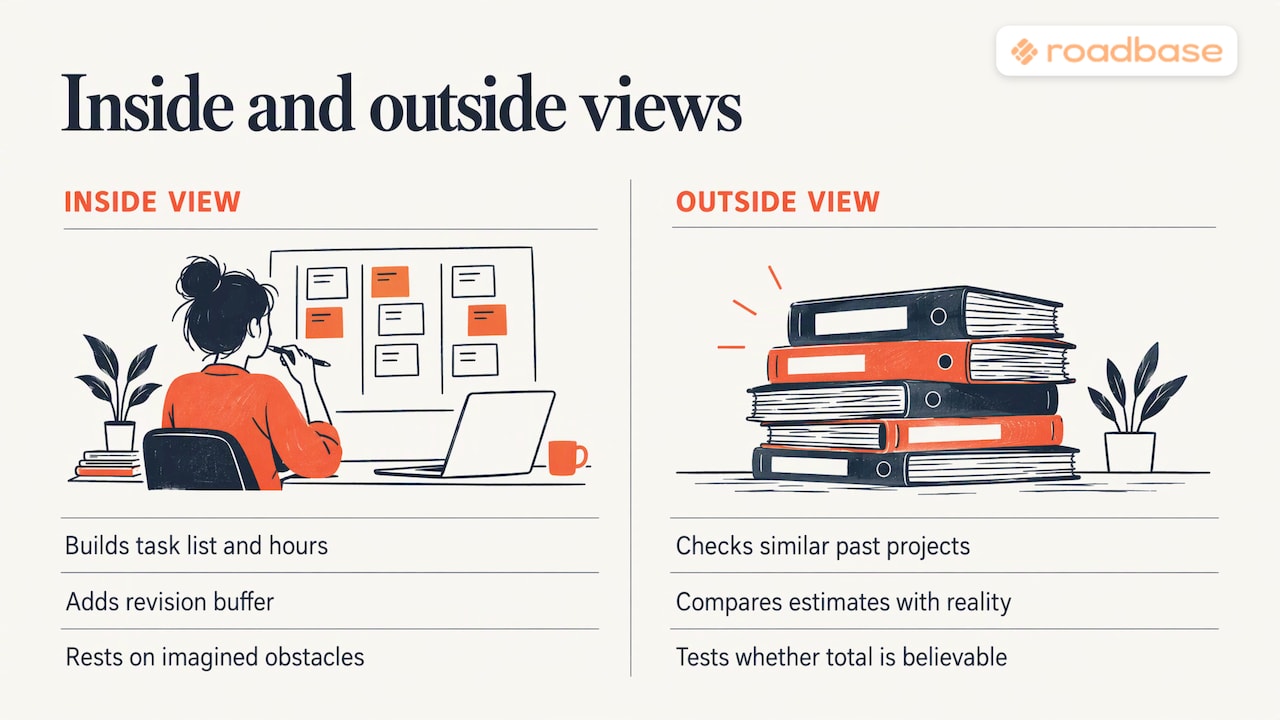
Most creative estimates are built from the inside. You list the deliverables, think about how long each takes, add a buffer for revisions and total it. The estimate rests on the plan and on the obstacles you can picture.
The outside view starts somewhere else. It asks: when we or others did projects like this, how did the estimates compare with reality? According to Flyvbjerg's analysis, the outside view can counter optimism bias and strategic misrepresentation by grounding the forecast in recorded outcomes rather than imagined scenarios or judgments of personal skill and control.
The two views are not rivals. The inside view gives you the detailed task list, roles and hours. The outside view tests whether that total is believable. Clifford Gray's advisory frames the comparison as a question that forces due diligence: why would this project not overrun by a percentage similar to past actual projects?
That question is as useful on a client call as it is in a boardroom. If you cannot answer it, you have a reason to review the estimate before quoting.
Does it actually work?
There is empirical support. A 2016 study by Batselier and Vanhoucke in the Project Management Journal, based on real project data, found that reference class forecasting performed best for cost and time against the Monte Carlo simulation and earned value management approaches compared in that evaluation. That result does not establish the same performance for every project or creative studio.
It also has a track record in the field. The UK Department for Transport guidance, quoted in the University of Oxford report for the Edinburgh tram extension, sets out the three-step method adapted here as a practical studio exercise.
A studio can use the same outside-view question: how does this estimate compare with recorded outcomes for similar work? Infrastructure evidence supports the method, but it does not validate a particular sample size or forecast for creative work.
The three steps, applied to creative work
The official three-step process is: choose a reference class of past projects, establish the distribution of outcomes, and place the new project in it. Here is what each step means when you sell brand identities, websites, video, campaigns or reports.
Step 1: Choose the reference class
The DfT guidance calls for a class broad enough to be statistically meaningful and narrow enough to be comparable. For creative work, that usually means grouping by type and scale: five-page marketing sites together, brand identity packages together, 60-second explainer videos together. An online store and a brochure site belong in different classes even if both are "websites."
There is a real trade-off between similarity and sample size: the narrower the class, the more relevant each project may be, but the more one or two projects can swing the percentiles. A "percentile" is the point below which a given share of outcomes fall. The 80th percentile marks the level that 80% of the historical sample stayed at or below; a small sample cannot establish a reliable P80 for future work.
Two rules keep you honest:
- Choose the class before you look at the results. Match type, scale, work boundaries and estimating stage so you are not choosing projects to support a preferred answer.
- Include every finished project of that type, including the ones that went badly. A class made only of your best projects forecasts your best case.
Step 2: Establish the distribution
For each project in the class, record the estimated hours (or fee), the actual hours (or cost) and the ratio of actual to estimated. A ratio of 1.00 means you hit the estimate. A ratio of 1.25 means the project took 25% longer.
Cenex's explainer describes this as expressing overruns as percentages and then reading the uplift at the percentile that matches the confidence you need. For a small studio, the practical version is simpler: use the median ratio as a historical midpoint, and look at the highest ratios as downside scenarios rather than future limits.
Keep the original estimate and any later scope additions as separate numbers rather than overwriting them, and note the main cause of variance. For creative work, the causes are usually familiar: extra revision rounds, late scope additions, slow client feedback, and unclear approvals.
Step 3: Place the new project in the distribution
Build your normal bottom-up estimate first, with tasks, roles and hours. Then compare it with the result of multiplying a comparable base estimate by your class ratio. Check the baseline first: do not add the historical uplift again if it already includes the same allowances. A short, bounded inside-view adjustment is reasonable if you have a specific, written reason, such as a repeat client who sends consolidated feedback. Use the comparison to make a pricing decision you can explain.
If your bottom-up number and the reference-class number disagree sharply, Cenex suggests treating the gap as a signal to investigate rather than averaging the two. The gap may point to a missing scope item, a different baseline or a poor class match.
A worked example
This is a hypothetical illustration, not a real client's data.
Suppose a brand studio quotes identity packages at $90 per hour. Over the past year it finished six comparable packages:
| Project | Estimated hours | Actual hours | Ratio |
|---|---|---|---|
| A | 60 | 66 | 1.10 |
| B | 80 | 100 | 1.25 |
| C | 70 | 77 | 1.10 |
| D | 90 | 126 | 1.40 |
| E | 65 | 72 | 1.11 |
| F | 75 | 94 | 1.25 |
The table rounds each ratio to two decimals. Using the unrounded ratios, the median is (72/65 + 100/80) / 2 = 1.1788461538, or about 1.18. The studio's bottom-up estimate for a new package is 80 hours.
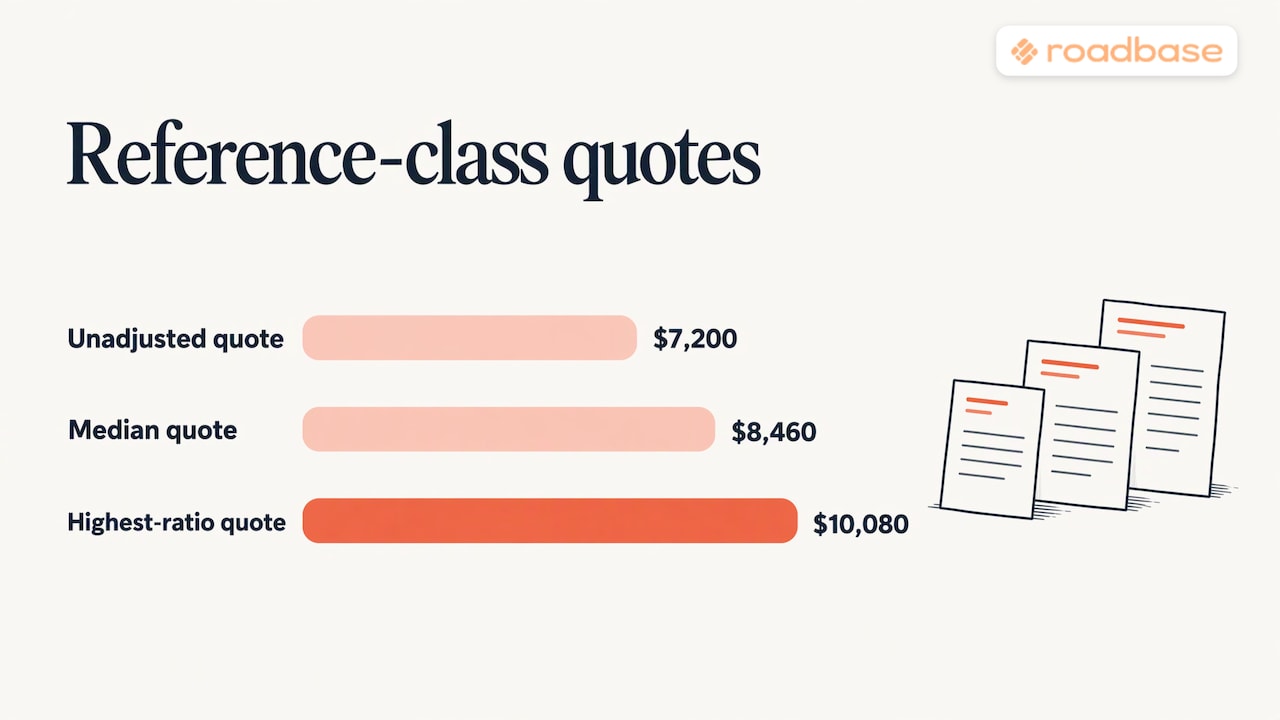
- Unadjusted quote: 80 hours at $90 is $7,200.
- Reference-class quote at the median: about 94.3 hours, rounded to 94 hours for this illustration. At $90 per hour, that is $8,460. Keeping the unrounded hours would give $8,487.69.
- Sample downside scenario at the highest observed ratio of 1.40: 112 hours, or $10,080.
The studio does not have to quote the top figure. It can use the median scenario while defining revision rounds and a process for agreeing change orders. Those terms clarify the scope; they do not guarantee recovery of extra effort. Six projects cannot establish a reliable P80 or a safe ceiling on future hours.
In this hypothetical example, the rounded median scenario is $1,260 above the unadjusted $7,200 quote. That is a difference in fees at the stated billable rate, not a measured profit loss or an amount lost on every future package.
Real examples of the method
These published examples come from large projects with documented outcomes or advanced completion records, but they show the logic clearly.
- A schedule forecast. In a 2013 PM World Journal paper, Bob Prieto used the documented schedule of a comparable large project in late completion. Its schedule indicated completion 21 months after the client's target, prompting reconsideration of the delivery approach.
- A public transport extension. The Oxford team behind the Edinburgh tram forecast narrowed a class of 152 completed light-rail projects to 89 extensions, because their cost and schedule risk differed from new builds. Choosing the narrower class changed the answer.
- A defense benchmark. An ICEAA workshop paper used 116 Major Defense Acquisition Programs across six commodity classes to illustrate a schedule outside view. This is a defense example, not a creative-industry benchmark.
The lesson for a studio is the same in each case: the class you pick should match the project you are pricing, and the evidence should be documented and comparable. For your own studio class, start with completed work.
Building a class from your own projects
Three to five finished projects of one type can give you a provisional starting exercise. They are not a statistically validated sample, and adding another project does not necessarily improve accuracy. For each project, capture:
- Project type and scale (for example, a five-page site or a 12-page annual report)
- Estimated hours by role and phase
- Actual hours by role and phase
- The ratio of actual to estimated
- The biggest miss, and why it happened
That list is simple, but it only works if time was tracked during the project. If you are building the habit, our guide on what to track for estimate versus actual covers the numbers that matter. For an optional further comparison, see this guide to business databases and reports. Whatever format you choose, use the recorded history when reviewing the next estimate.
When you have little history, you can still borrow structure. Our article on analogous estimating for creative quotes shows how to use one similar past project as a starting point, and parametric estimating shows how to scale a rate per unit, such as per page or per minute of video. A comparable project group can then help you question the result, with more caution when the history is thin.
For the bottom-up layer that sits underneath all of this, see how to estimate project hours before you quote and how role-based estimating prices work by task.
Where the method needs care
The usefulness of the comparison depends on the projects and records behind it.
- Class quality sets forecast quality. A forecast can only be as relevant as the class behind it. Mixing a logo refresh with a full rebrand muddies the ratio.
- Stable data matters. A 2025 Cranfield review critically examines the method's validity, applicability and limitations. In practice, keep comparable records and check their quality; consistent tracking alone does not resolve poor class selection or thin data.
- Late scope changes are a scope problem. As a practical recordkeeping rule, separate changed scope from baseline effort. Define how changes will be agreed in your proposal, and compare projects with similar work boundaries.
- It complements detailed planning. A historical benchmark complements task-level planning. Keep your task-level estimate and use the class to check it.
- Extremes can fall outside history. Flyvbjerg notes the outside view may miss outcomes beyond all precedent, so a one-of-a-kind project deserves extra scrutiny of its scope.
How Roadbase supports the routine
The hard part of reference class forecasting is not the arithmetic. It is having clean estimated-versus-actual records and then remembering to use them when a new brief arrives.
Roadbase supports the planning and recording parts of that loop. Paste brief text or attach a PDF to generate an editable first draft with phases, tasks, roles and hours. Review and adjust the draft, then check your rates, overhead, contingency and target margin together. Track project and task hours and compare them with the estimate. With sufficient relevant recorded data, planned-versus-tracked task hours by role can inform a later estimate draft for you to review.
Start with your own numbers
Bring an existing brief or PDF into Roadbase to build an editable project plan and quote. Review the tasks, roles, hours and pricing, then export the reviewed proposal as a PDF. Start recording the hours that future project comparisons will need.
See the plans on the Roadbase pricing page. If you are comparing approaches first, our roundup of project forecasting tools for creative teams lays out the options.
Our perspective
An underpriced project can start with a good plan that assumed everything would go to plan. Reference class forecasting is the discipline of asking what happened last time.
We built Roadbase around that idea. A quote should start from a structured roadmap with roles, hours and margin, then be checked against relevant tracked history. When there is enough relevant recorded data, planned-versus-tracked hours by role can inform the next draft. You still need to review what it suggests.
Spreadsheets have their place for simple jobs. For complex projects with phases, dependencies and revision rounds, the estimate and the actuals belong in one system, where you can compare them without rebuilding the picture by hand.
Start small: pick one project type, record every finished job, and compare the next estimate with that history. Keep the first ratio provisional. The habit and the quality and size of the sample all matter.
Nicolas Robertson
FAQ
What is the difference between reference class forecasting and analogous estimating?
Analogous estimating scales from one similar past project. Reference class forecasting uses a group of similar projects and the spread of their outcomes. The group shows a historical midpoint and how bad the recorded cases got; it does not set a limit on future outcomes.
How many past projects do I need?
Public-sector guidance for large projects asks for a class of normally at least 10 comparable projects. A freelancer can begin with three to five of the same type and treat the first ratio as provisional. More relevant records can help, but each new project does not automatically make the forecast more reliable.
Should I quote the average overrun or a higher percentile?
The median is the historical midpoint. A higher percentile corresponds to a higher historical uplift, but its usefulness depends on a credible, comparable sample. Choose a position based on the consequences of overrunning and the evidence you have. Scope limits and an agreed change process help define the work; they do not guarantee coverage of the tail.
Can I use industry figures if I have no history?
Use industry figures as a provisional cross-check only if the work, scope boundaries and estimating stage are comparable. Do not treat infrastructure or defense figures as studio benchmarks. Build your own records and review their relevance before replacing an external comparison with a small local sample.
Sources
- Flyvbjerg, From Nobel Prize to Project Management (arXiv)
- University of Oxford report, Reference Class Forecast for the Edinburgh Tram
- Gray, Revisit Reference Class Forecasting (PM World Journal, 2018)
- Batselier and Vanhoucke, Practical Application and Empirical Evaluation of Reference Class Forecasting (2016)
- Cenex, Reference Class Forecasting and Optimism Bias Explained
- Prieto, Managing the Planning Fallacy (PM World Journal, 2013)
- ICEAA 2022, Delusions of Success (Voth)
- Cranfield University, Reference class forecasting: promises, problems (2025)