

Risk Scoring Matrix: How to Score and Rank Project Risks
A risk scoring matrix ranks project risks by giving each one a likelihood score and an impact score, then combining the two into a single number you can sort. For a freelancer or agency, the payoff comes before the project starts: the scores show which risks deserve a line in the quote, which deserve a conversation with the client, and which need further review.
This guide shows how to build the matrix, which formula to use, how to score a real creative project, and how to use the result when reviewing your price.
TL;DR
- A risk scoring matrix multiplies (or weights) likelihood and impact, usually on 1 to 5 scales, so risks can be ranked and sorted into low, medium and high bands.
- Some teams choose to give impact extra weight. That is a policy preference, not a universal rule.
- Score risks during scoping, before you quote, then review response costs and uncertainty when setting contingency, assumptions and revision limits.
- Ratings are judgments. Write down what each number means and score as a group to keep them consistent.
- Roadbase turns brief text, notes or a PDF into an editable draft plan; review hours, rates, overhead, contingency and margin as you form the quote.
Table of Contents
- What a risk scoring matrix does
- Build the scales first
- Pick a scoring method
- A worked example: a brand website redesign
- From scores to your price
- How to run a risk scoring session during scoping
- Keep ratings consistent
- Where Roadbase fits
- Our perspective
- FAQ
- Sources
What a risk scoring matrix does
A risk is something that might happen and would change your cost, schedule or margin if it did. A risk matrix puts every risk on a grid. One axis is how likely it is. The other is how much damage it does.
Roger Graves, writing for PMI, describes an example 5x5 array divided into red, yellow and green zones. Red marks major risks, yellow moderate ones and green minor ones. The red zone sits where high impact meets high likelihood, and green sits where both are low.
The value is prioritization. A matrix helps you choose where closer review is needed. The number needing action depends on the project. Even a low score needs attention if the possible consequence is unacceptable.
Build the scales first
The quality of a matrix depends on its scales. If "medium" means one thing to you and another to your project manager, the numbers are decoration.
Choose five levels
Graves uses a five-level scale from 1 (very low) to 5 (very high). This is one workable choice. PMI's practitioner article on prioritization also describes using three or five categories.
Anchor every level to something measurable
Define each level in your own terms. For creative work, the anchors that matter are hours, dollars and delivery dates. Here is an illustrative scale a small studio could adapt:
| Score | Likelihood | Impact on the project |
|---|---|---|
| 1 | Very unlikely (under 10%) | Under 4 hours of extra work, no date change |
| 2 | Unlikely (10% to below 30%) | 4 to under 15 hours, or a few days of slip |
| 3 | Possible (30% to below 50%) | 15 to under 40 hours, or one week of slip |
| 4 | Likely (50% through 80%) | 40 through 80 hours, or a missed milestone |
| 5 | Near certain (above 80%, below certainty) | More than 80 hours, or a margin-threatening overrun |
These are article-authored examples, not agency benchmarks. Use the highest applicable impact category when hours and schedule differ. A certain event is a known issue to plan for. Set them against your own typical project size, so that a "5" really is a problem for your business. A freelancer with a $6,000 project and an agency with a $120,000 retainer need different impact anchors.
PMI's three-point example shows the same idea with probability ranges: 1 for 1 to 40%, 2 for 41 to 70%, and 3 for 71 to 99%. Write down and share the ranges. These categories rank judgments: a rating of 4 is not twice the probability or cost of 2. A product score of 20 is neither 20% nor a money amount.
Pick a scoring method
Here are three approaches to combining ratings.
Multiply likelihood by impact
A common formula is Risk Score = Likelihood x Impact. On 1 to 5 scales, scores run from 1 to 25. A Denver, Colorado infrastructure program's project risk assessment guidelines use exactly this layout. Their sample bands are Low for 1 to 6, Medium for 7 to 12 and High for 13 to 25, used to decide which risks need closer analysis.
PMI's article on simple risk assessments describes the lightest version: rank each risk low, medium or high as 1, 2 or 3, then multiply the two scores to get a probability-to-impact rating.
Weight impact more heavily
Roger Graves, writing for PMI, argues that a 10 percent chance of losing $1,000,000 is usually treated as worse than a 90 percent chance of losing $1,000. His example formula is Severity = Likelihood + 2 x Impact. Scores run from 3 to 15, with red at 12 to 15, yellow at 8 to 11 and green below 8.
This matters for small studios. A rare event that would take your lead designer off a project for a month can hurt more than a frequent annoyance. A weighted formula changes the ranking to reflect your preference for impact. It does not make the ratings more accurate. Review severe consequences whichever formula you choose.
Use a multi-factor score
Larger projects sometimes score several impact types separately, such as cost, schedule, quality and reputation. In PMI's practitioner example, five impact factors scored 1 to 3, summed then multiplied by probability scored 1 to 3 produce totals from 5 to 45: (I1 + I2 + I3 + I4 + I5) x L, and the team decides which totals count as high, moderate or low. Separate impact factors are useful when the consequences need separate discussion. Start with one impact score and add factors only if you keep disagreeing about a rating.
A worked example: a brand website redesign
Say your studio is quoting a brand identity and website project for a regional retail client. The brief is two pages of notes and a link to the old site. During scoping you list six risks and score each with both methods. Both band systems below are illustrative policies, not universal thresholds.
| Risk | L | I | L x I | Band (1-6 / 7-12 / 13-25) | L + 2I | Zone |
|---|---|---|---|---|---|---|
| Unclear brief leads to scope creep | 5 | 4 | 20 | High | 13 | Red |
| Client delivers copy and images late | 4 | 4 | 16 | High | 12 | Red |
| Feedback rounds exceed the contract | 4 | 3 | 12 | Medium | 10 | Yellow |
| Third-party booking integration fails | 3 | 4 | 12 | Medium | 11 | Yellow |
| Lead designer unavailable for two weeks | 2 | 5 | 10 | Medium | 12 | Red |
| Font or stock licensing costs rise | 2 | 2 | 4 | Low | 6 | Green |
Three things stand out.
First, scope creep and late content are the clear priorities under both methods. Review responses such as written assumptions, a fixed number of revision rounds and a content deadline, then assess the remaining uncertainty.
Second, the designer absence risk moves from Medium to Red when impact is weighted. The labels reflect different policies; neither proves tolerability. A named backup is one response to investigate under either method.
Third, the licensing risk is green under both. Review the consequence and response cost before accepting it. Recheck severe or uncertain risks regardless of color.
From scores to your price
A score helps you choose what to examine before pricing. Estimate plausible extra hours, direct costs and response costs separately, then review the uncertainty left after those responses. Do not convert a 1-25 score into currency or a contingency percentage.
- High scores prompt closer review. Clarification, a backup, a scope boundary or an approval may be more useful than a surcharge; contingency depends on the remaining costs and uncertainty.
- Medium scores need an owner and a response decision, with relevant assumptions recorded in the proposal.
- Low scores can be accepted after reviewing the consequences, then revisited if the project changes.
A payment milestone may change cash-flow exposure, but it does not itself remove the underlying risk.
To size the reserve, our guide to picking a defensible contingency percentage walks through how to justify the number to a client. For the wider logic of pricing uncertainty into a quote, see risk-based pricing for creative project quotes. If you want a place to record each risk with an owner and a response, the agency risk register template gives you the columns.
Once risks are ranked, someone must own each response. A decision rights matrix can help record who may approve contingency spending or a scope change.
How to run a risk scoring session during scoping
Allow enough time for the complexity and decisions at stake.
- List the risks from the brief. Read the client's notes and mark every vague phrase, dependency and assumption. "Modern feel," "integrate with our systems" and "content to follow" each hide a risk. Add risks from your own past projects.
- Describe each risk as a cause and effect. Write "client content arrives late, pushing build by one to two weeks," not "content." A sharp description is easier to score.
- Score likelihood and impact separately. Do it before you multiply. Score likelihood from your history with similar clients, and impact from your hours and rates. If two people on the team disagree by two or more points, discuss the reason, because the disagreement usually exposes an assumption.
- Calculate and sort. Rank using your chosen formula and documented bands. Recheck rare but severe risks even when they rank lower.
- Assign a response and an owner. Consider clarification, prevention, a backup, a scope boundary or acceptance. A client term does not automatically transfer responsibility; check what the agreement actually assigns. Record who watches it.
- Price and word the proposal. Estimate response costs and plausible remaining extra work before choosing contingency. Record relevant assumptions and scope boundaries, and keep response decisions visible in your notes.
- Review at milestones. Scores change as the project does. A risk with a likelihood of 4 at kickoff may drop to 1 once the client delivers the content.
A weak point to watch for is the connection between steps 1 and 6. Brief notes sit in one document, risks in a spreadsheet and the quote in another file, and the link between a risk and a price line gets lost. Keeping the chain in one place is what makes the matrix a pricing tool instead of an exercise.
Keep ratings consistent
A matrix depends on judgments and category boundaries. A small rating change can cross a color band without a meaningful change in the underlying risk. For a discussion of heat-map limitations, see this Journal of Modern Project Management paper. Keep the category limits in view when using the matrix:
- Write the scale definitions down and attach them to every scoring session.
- Score independently first, then compare, so the loudest voice does not set the number.
- Use ranges that match your business. An impact of "5" should mean the same dollar or hour threshold every time.
- Treat scores near a band edge with care. A 12 and a 13 are neighbors, even if the labels differ. Look at what the risk does, not only which color it lands in.
- Compare to reality. After each project, check which risks occurred and how many hours they cost, then adjust your scales. Our guide on estimate versus actual tracking covers what to capture.
Project records give you evidence to review your assumptions and scale definitions. The scores remain judgments, even as that evidence improves.
Where Roadbase fits
Start with your brief text, notes or PDF in Roadbase to generate an editable draft project plan with phases, tasks, roles and estimated hours. Review and adjust the draft assumptions alongside your human risk assessment. Review role rates, hours, overhead, contingency and margin while forming the quote, then export the reviewed plan and quote as a proposal PDF.
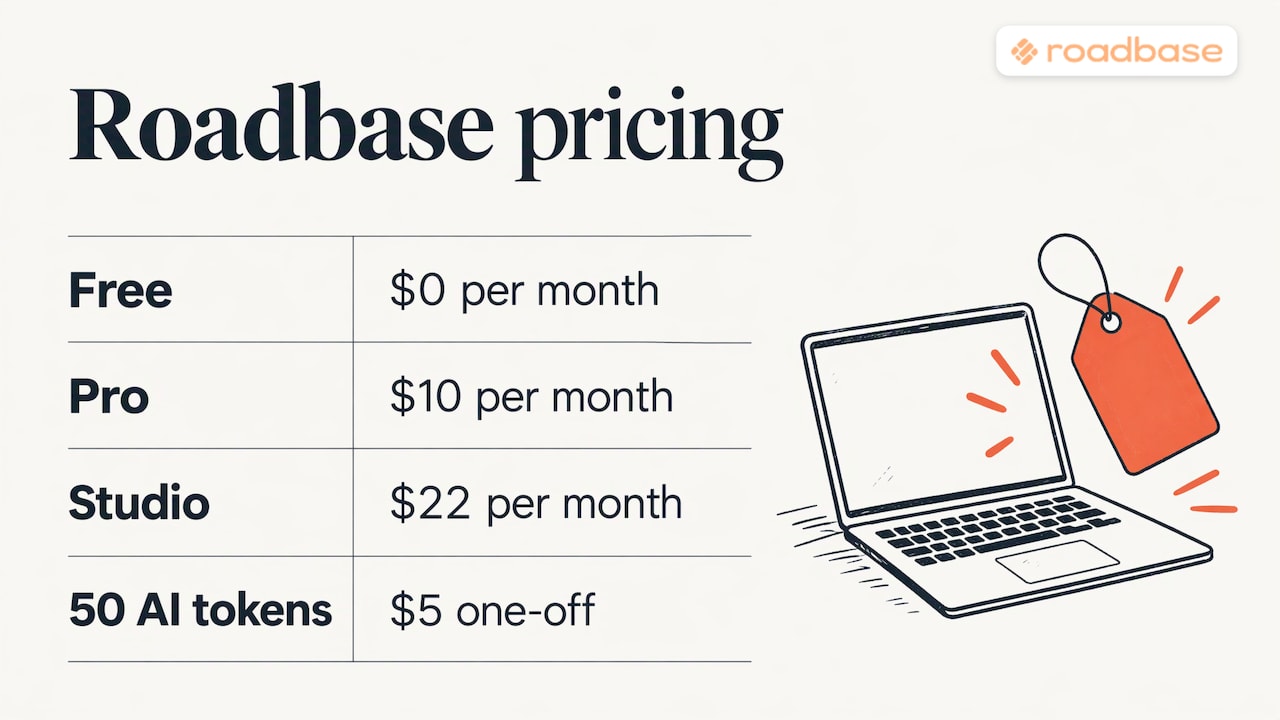
Track hours against tasks and roles and compare actual hours with the estimate to support your next review. See the Roadbase pricing page for current plan details.
If you quote software or integration work, the software integration scope and estimate guide shows how the same risk thinking applies to technical dependencies.
Our perspective
A designer who expects a client to rewrite the brief has a judgment worth recording. Writing down the possible cause, effect and response makes that judgment easier to review with the team.
The useful connection to a quote is the work behind the score: which tasks might grow, who would do them, and what assumptions the client needs to understand. A simple 5x5 grid can start that conversation. Roadbase can then help draft a plan from the brief so you can review the hours and quote inputs before exporting a proposal. The team still decides how to respond to the risks.
FAQ
What is the difference between a risk matrix and a risk register?
The matrix is a scoring grid that ranks risks by likelihood and impact. The register is the log that records each risk with its description, score, owner and response. You use the matrix to fill in the score column of the register.
Should I multiply or add likelihood and impact?
Multiplying is a common method and gives scores from 1 to 25 on a 5x5 scale. A formula such as Likelihood + 2 x Impact gives impact extra weight as a policy choice. Choose and document the approach that fits your decisions, and review severe consequences regardless of their score.
How many risks should a project matrix include?
Include risks you can describe as a specific cause and effect; the number depends on complexity. One infrastructure case described by PMI scored a register of 25 active risks on a 5x5 matrix and ended up with one high, seven significant, eleven medium and six low. Those counts describe that case, not a target for your project.
When should I score risks, before or after quoting?
Before. Scoring during scoping helps identify which responses, assumptions and costs to examine before setting contingency and revision limits. Review the scores at each milestone and update them as the client delivers materials and decisions.
Sources
- PMI: Qualitative risk assessment
- PMI: Integrating risk analysis and prioritization
- PMI: Risk assessments, developing the right assessment
- PMI: Quantifying risk
- Denver Performance-Based Infrastructure Program: project risk assessment guidelines
- Journal of Modern Project Management: Deficiencies in and alternatives to heat map risk matrices