

Project Burn Rate: How to Calculate and Use It
Project burn rate shows how quickly a project uses planned hours or internal cost. Divide what you've used by the weeks or months elapsed, then compare that pace with the plan and the work completed. A faster pace deserves a closer look; it doesn't tell you on its own whether the project is in trouble.
This guide is for freelancers, studio producers and agency leads quoting creative work. It covers the calculation, a fixed-fee example, a progress check and a simple way to review the work left.
TL;DR
- Average project burn rate = hours or internal cost consumed / periods elapsed. Keep the unit and period consistent.
- This is different from company cash burn, which concerns a business's gross and net monthly spending against its reserves.
- Burn measures consumption, so compare it with completed work. Formal earned value uses budgeted values for that comparison.
- A time-phased plan of deliverables, roles and hours makes a weekly number useful.
Table of Contents
- What project burn rate means (and what it doesn't)
- How to calculate project burn rate
- Burn rate alone can't tell you if a project is healthy
- What to track in a burn rate spreadsheet
- Why your baseline decides whether burn rate is useful
- How to read the signals
- What is a good burn rate?
- Review cadence and reforecasting
- Our perspective: burn rate is a symptom of the estimate
- Put the plan and the tracking in one place
- FAQ
- Sources
What project burn rate means (and what it doesn't)
Search results use "burn rate" for both company finances and individual projects. They answer different questions.
Company burn rate describes the cash a business uses over time. Gross burn is cash outflow; net burn considers cash inflow too, as Carta explains. Company runway is a separate cash-planning question.
Project burn rate, as used here, is practical shorthand for the hours or internal cost a single job uses per period. It isn't one universal PMI formula: PMI's paper on burn rate versus earned value uses a different productivity measure, hours per percentage point of completion. Name your unit when you share a burn figure:
- Hourly burn: hours logged per week against planned hours.
- Cost burn: internal cost of logged hours and recorded project expenses per week, compared with a baseline that includes the same kinds of cost.
- Budget used: cumulative hours or internal cost as a share of the corresponding planned total.
The internal-cost view helps a fixed-fee studio see how much of its cost allowance it has used. It is not a measure of cash received from the client.
How to calculate project burn rate
Choose hours or like-for-like internal cost, and keep the time period the same in each comparison:
Actual average burn rate = cumulative hours (or internal cost) / periods elapsed
Simple planned average = planned hours (or internal cost) / planned periods
Remaining average allowance = (planned hours or cost ceiling - amount consumed) / periods remaining
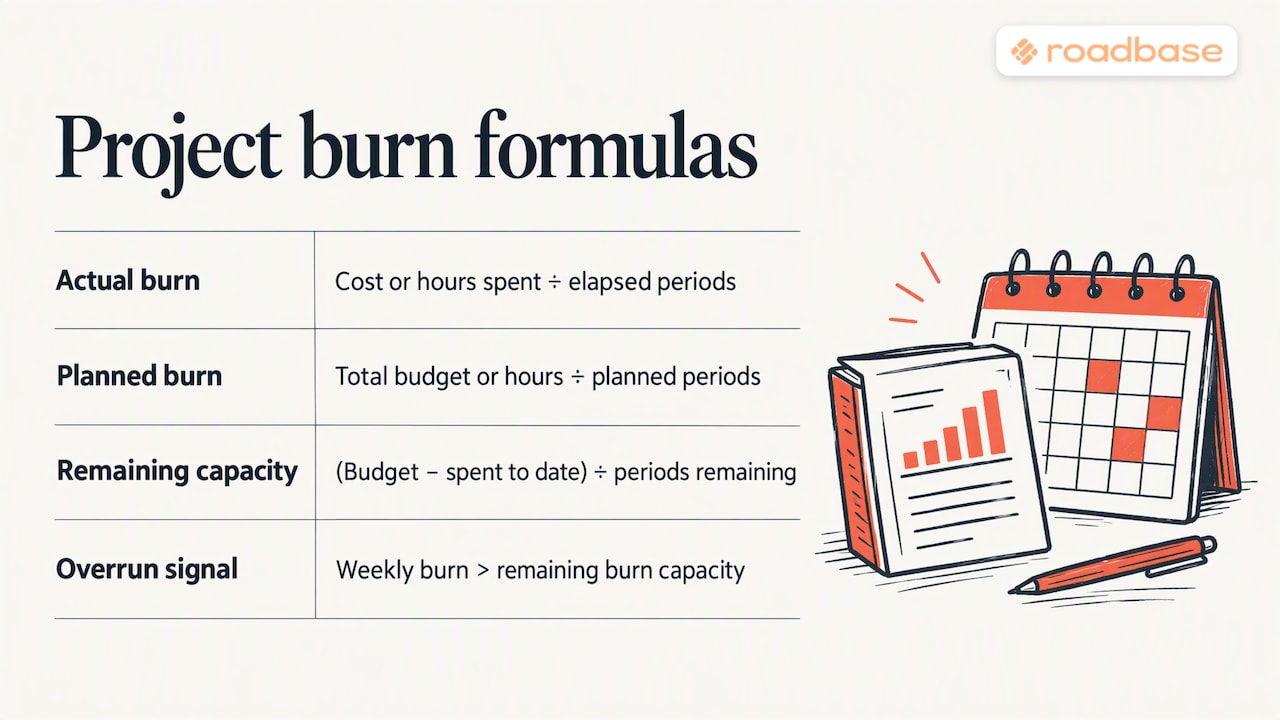
A simple average is a first check. If discovery takes more effort than handover, compare each period with its time-phased plan as well. An actual rate above the remaining allowance points to an overrun if that pace continues for the remaining duration. Finishing sooner or changing the work left changes the projection.
A worked example
These figures are hypothetical. A studio quotes a brand identity project for a fixed $24,000 fee over eight weeks. It plans 240 labor hours at $15,600 of internal cost, or $65 per hour on average. The $8,400 difference is a 35% planned gross project margin on that defined internal cost, before any overhead or expenses left out of the example.
At the end of week three, the team has logged 114 hours and $7,410 of internal cost.
| Measure | Eight-week plan | After week 3 |
|---|---|---|
| Average weekly hours | 30 | 38 (114 / 3) |
| Hours used | 90 planned by week 3 | 114 of 240 |
| Average weekly internal cost | $1,950 | $2,470 ($7,410 / 3) |
| Cumulative internal cost | $5,850 planned by week 3 | $7,410 |
Five weeks remain. The remaining hour allowance is (240 - 114) / 5 = 25.2 hours per week, 12.8 below the current 38-hour pace. Before projecting a finish, check the unfinished work, timing and approvals. If the team logged 38 hours in every one of the eight weeks, it would reach 304 hours and $19,760 in internal cost. With the same fee and cost assumptions, that would leave a 17.7% gross project margin.
Burn rate alone can't tell you if a project is healthy
The example shows more cost used than planned by week three, but hours alone don't show what was finished. The linked PMI discussion of burn rate versus earned value distinguishes effort consumed from progress earned.
Formal earned value uses three measures on the $15,600 budgeted internal-cost baseline, not the $24,000 client fee, as PMI describes them:
- Planned value (PV): budgeted internal cost of work scheduled to be complete by now.
- Earned value (EV): budgeted internal cost of work actually completed.
- Actual cost (AC): internal cost incurred for that work.
The cost performance index is EV / AC; the schedule performance index is EV / PV, as set out in PMI's project health paper. Suppose week-three PV is $5,850, EV is $5,200 and AC is $7,410:
- CPI = $5,200 / $7,410 = 0.702. The team has earned about 70 cents of budgeted internal-cost work per dollar of actual internal cost. That is not revenue or profit.
- SPI = $5,200 / $5,850 = 0.889. Less budgeted work has been completed than planned at this point. This ratio alone does not measure calendar days late.
In this example, EV is $5,200 / $15,600, or about 33.3% of the total budgeted work. A simple count of completed deliverables treats small and large items equally, so it cannot stand in for that weighted EV figure. A team without assigned budgeted values can still compare completed deliverables with hours used; it should call that a practical progress check, not a formal CPI or SPI calculation.
A lighter version for small teams
You can start with a short list of deliverables, planned hours, actual hours and an agreed completion rule. PMI's deliverables-based "EVM lite" approach shows one way to give deliverables planned values and check them against actual cost.
Decide in advance what counts as progress. Client acceptance can be one milestone, but a team can also give objective partial credit at agreed stages such as start, draft completion and acceptance. The important part is using the same rule at every review, so a nearly finished deliverable doesn't quietly become a finished one.
What to track in a burn rate spreadsheet
A spreadsheet works well as a starting point. For this kind of fixed-fee job, useful columns include:
- Project and reporting period
- Phase and deliverable
- Role and internal cost rate
- Planned and actual hours
- Planned and actual internal cost
- Direct expenses included in the baseline and actuals
- Approved changes to the work
- Progress stage or completed milestone
Set the review frequency to the job. Weekly entries can help on a fast-moving eight-week project if time is recorded promptly; a shorter sprint or a slower milestone-based engagement may call for a different rhythm.
Approved changes help explain whether additional hours came from an agreed client request, internal rework or something else. The guide to preventing scope creep in creative projects offers a way to make that boundary explicit.
Internal cost rate is what an hour costs the project under your chosen assumptions. It differs from the billable rate charged to a client. If you're setting a client-facing rate, this further reading on setting your hourly rates covers that separate decision; don't insert the billable rate into an internal-cost burn calculation.
Why your baseline decides whether burn rate is useful
A burn chart compares actual work with an earlier plan. A single lump-sum estimate gives it little detail to compare.
GAO's cost estimating guide discusses structured work and schedule baselines in large programs. For a small creative job, the practical lesson is to name the deliverables, the roles and hours behind them, and when that work is expected. The plan can then show whether heavy spending in week three was expected or surprising.
One workable sequence is:
- List phases and deliverables. For a brand identity job, that might mean discovery, concepts, a defined number of review rounds, final assets and handover. Each item gives you something concrete to check.
- Assign roles and hours. Include who handles strategy, design and production, and how much review time is planned. Role-based estimating explains that task-level approach.
- Build the cost baseline. Apply internal cost rates and include the overhead or direct expenses the quote assumes. Keep the client fee separate so the planned margin calculation is intelligible.
- Place the work in time. Assign phases and budgeted effort to the weeks or milestones when they're expected, rather than assuming a flat burn every week.
- Record actuals and progress. Log hours and comparable cost, then mark deliverables against the completion rule you chose.
- Review and re-estimate work left. Use the difference to ask what changed and to estimate remaining hours and cost from the unfinished tasks.
A project budget breakdown makes the cost categories easier to see, while estimating hours before you quote gives the later burn review a starting point.
How to read the signals
These patterns suggest questions to ask, not diagnoses:
| What you see | Possible explanation to check | First check |
|---|---|---|
| Burn ahead of plan, progress ahead too | Work may be front-loaded | Compare with the planned phase curve and what remains |
| Burn ahead of plan, progress behind | Effort, rework or role mix may differ from the estimate | Find the tasks and costs creating the gap |
| Burn on plan, progress behind | A dependency or review may be holding work up | Check milestone evidence and pending decisions |
| Burn below plan, progress behind | Work may be waiting on capacity or feedback | Check assigned hours and approvals |
| Burn rising late in the project | Planned production or extra revisions may be driving it | Compare with the planned rounds and accepted changes |
For a fixed-fee project, compare cumulative internal cost with the budgeted value of finished work when you have those values. Otherwise, compare the simpler deliverable record with hours used and investigate any gap. The PMI analysis of earned value alongside agile methods gives additional context for connecting cost and delivery evidence.
Cash timing is a different check. A fee may be profitable under your cost assumptions while a late client payment still strains cash. The SBA article on classic budget and forecast failures addresses the difference between profit and cash timing. Review payment dates separately from this project's internal-cost burn.
What is a good burn rate?
There is no universal target. The useful rate depends on when the work is scheduled and what has been completed. Ask:
- Is the current period close to its planned curve? A week of concentrated design work may use more hours than a week of handover.
- Is progress keeping pace with cost? Use weighted EV if you assigned budgeted values, or a clearly labelled deliverable check if you didn't.
- What does the remaining work require? Compare a fresh task-by-task estimate with the hours and cost allowance left.
This ResearchGate figure shows a non-flat curve in one high-complexity R&D project. For your creative project, compare actual burn with your own time-phased baseline.
Review cadence and reforecasting
Match the review to the duration and pace of the job. For the eight-week example, a weekly check is practical if hours and progress are current. At each review:
- Update the record. Enter actual hours and comparable cost, then mark the deliverables or milestones reached.
- Compare with the plan. Check this period and cumulative burn against the time-phased baseline and remaining allowance.
- Explain material gaps. Identify the task, change or approval behind each important difference before treating it as a trend.
- Estimate unfinished work anew. Add the hours and internal cost still expected; then calculate the revised gross project margin against the fixed fee under the same cost assumptions.
- Choose the next action. Re-plan work, discuss an agreed change, or keep the plan if the evidence supports it.
Regular plan-versus-actual review is the useful habit described in the SBA budgeting article above. A timely review can expose a variance earlier; its value depends on accurate entries and a decision someone can make. The estimate versus actual guide goes deeper on that comparison.
Our perspective: burn rate is a symptom of the estimate
A fast burn sends us back to the original plan. Was the number of concepts clear? Were review rounds and production files included? Did the quote allow for the people and hours the job actually needs? Those are questions to investigate, not a presumption that the estimate caused every gap.
Tracking helps because it makes the difference between planned and actual hours visible while there is still work to discuss. A small spreadsheet can do that for a single project. As jobs overlap, it helps to keep the estimate, tasks and time record connected so the team can see which assumptions need another look.
The goal isn't the lowest possible burn. It's a plan whose costs and progress you can explain, and a revised estimate of the work still to do.
Put the plan and the tracking in one place
Have a live brief and want a baseline you can review? Bring your notes or PDF into Roadbase, shape the editable first draft of phases, tasks and estimated hours, then review role hours, internal costs, expenses, overhead, contingency and target margin before you quote. You can export the reviewed plan and quote as a proposal PDF.
Once the work is approved, keep its tasks connected to tracked time and compare actual hours with the estimate as the job moves. The draft and cost assumptions are yours to review and adjust. You can see the current plans, or Explore Roadbase with a real brief in hand.
FAQ
What is the formula for project burn rate?
Divide cumulative hours or like-for-like internal cost by the periods elapsed. In the example, $7,410 of internal cost over three weeks is $2,470 per week. Compare it with the planned rate and the remaining average allowance: (planned amount - consumed amount) / periods remaining.
What is the difference between project burn rate and company burn rate?
Company burn rate concerns a business's cash use over time; per Carta, net burn also accounts for cash coming in. Project burn rate here is the hours or internal cost one job consumes against its plan. It does not tell you the business's cash runway.
Is a high burn rate always bad?
No. A phase may be planned to use more hours, or extra effort may have completed more budgeted work. Compare the rate with the phase plan, completed work and what remains before changing the quote or schedule.
How often should I check project burn rate?
Use a cadence that fits the job's length and decision points. Weekly can work for a fast eight-week creative project when hours and progress are entered promptly. Review sooner around a major milestone or change; a slower project may need fewer checks.
Sources
- Carta: Burn rate calculator
- PMI: Earned value management systems
- PMI: Burn rate vs. earned value
- PMI: Understanding project health metrics
- PMI: EVM lite, a deliverables-based approach
- PMI: Complementing agile methods with EVM
- GAO Cost Estimating and Assessment Guide
- SBA: 5 classic fails in budgets and forecasts
- ResearchGate: Project burn rate for a typical high-complexity project