

30-180 Day Plan to Improve Proposal Win Rate with Benchmarks & AI
Proposal win rate tells you how many proposals become won projects. It can help you decide where to spend proposal effort, but only if you count outcomes consistently. A small studio that wins 14 of 40 resolved proposals has a 35% win rate for that group. Whether that is useful depends on what those 40 proposals had in common.
TL;DR:
- Define which proposals and outcomes count before comparing percentages.
- Track proposals by submission period, then wait for their outcomes to resolve. Keep pending and no-decision work visible.
- Compare similar work: a warm packaging referral and a competitive motion-design RFP belong in different groups.
- Use 30-180 days to establish a baseline, try a few process changes, compare resolved cohorts, and choose the next change to test.
- Use AI to prepare an editable project-plan draft; review the work, hours, costs, and proposal before sending it.
Table of Contents
- Defining and Calculating Proposal Win Rate Consistently
- Benchmarks and Stage Win Rates Worth Tracking
- Why Win Rates Vary So Much Between Teams
- Measuring Win Rate Reliably and Using It to Forecast
- Tactics to Raise Win Rate Within 30 to 180 Days
- How Data-Driven Scoping Supports Higher Win Rates
- Common Mistakes When Calculating and Interpreting Win Rate
- Examples of Win Rate Changes and Their Impact
- How Industry and Sector Differences Shape Win Rates
- Tools and Software for Tracking Win Rate
- Where to Look First in Your Own Win-Rate Data
- Roadbase Helps You Move From Brief to Reviewed Priced Proposal
- FAQ
- Sources
Defining and Calculating Proposal Win Rate Consistently
Start with a rule you can repeat: win rate = won proposals / resolved proposals x 100. Record when each proposal was sent and whether it was won, lost, withdrawn, or still pending. Decide in advance how to handle a client who never makes a decision. The proposal acceptance rate definition from KPI Depot uses accepted proposals over proposals sent; that can answer a different question from wins over resolved decisions. Label your denominator so readers know which one you used.
Three habits make the figure more useful:
- Group proposals by the month or quarter they were sent. Follow that same group until the outcomes resolve instead of dividing this month's wins by this month's submissions.
- Publish the counts beside the rate. Four wins out of eight and 40 wins out of 80 are both 50%, but one new decision moves the smaller group much more.
- Separate unlike pursuits. A referral for a brand refresh, a public tender for an event installation, and an unsolicited pitch have different starting conditions. Compare each with similar work before combining them.
For an illustrative cohort with 40 resolved proposals and 14 wins, the result is 35% (14 / 40 x 100). That is arithmetic, not a target for creative teams. Use the same rules next period before calling a change meaningful.
Benchmarks and Stage Win Rates Worth Tracking
An external win-rate figure is useful only when you can see what it measures: the buyer group, proposal type, time period, stage, and denominator. A grant application, a federal contract bid, and a studio quote all get called a proposal, yet they pass through different decisions. Stanford's guidance on proposal preparation explains the submission requirements for academic grants; it does not establish a commercial proposal benchmark.
When you inspect a published figure, ask whether it includes every sent proposal, only qualified opportunities, or only decisions already made. Also check whether renewals and referrals are mixed with competitive bids. The stage conversion analysis from MetricGen is further reading on stage definitions, not a benchmark adopted here. Different definitions can produce different rates from the same underlying proposals.
Your first benchmark can be your own recorded baseline. Keep the numerator, denominator, proposal count, and mix together. A change in the mix may explain a changed rate before any proposal practice does.
Why Win Rates Vary So Much Between Teams
A win-rate change gives you a question to investigate, not a diagnosis. Review a few recent proposals and look for patterns in five places:
- Fit: Was the brief within the team's skills, capacity, and preferred project size? Record why you bid even when you lose.
- Buyer priorities: Did you understand who would decide and what mattered to them? In a formal tender, the written evaluation criteria may answer part of that question.
- Requirements: Did the response address the requested deliverables, timeline, and submission format clearly?
- Price and assumptions: Could a buyer see what was included, what depended on their input, and how the price related to the proposed work?
- Review: Did someone other than the drafter check the proposal against the brief before submission?
In federal contracting, Hinz Consulting's analysis of proposal win probability discusses qualification and early preparation. Those are practices a creative team can test, but the federal setting supplies no effect size for a studio's proposals.
Pro Tip: Try a short bid/no-bid review. Write down the client's need, decision route, budget information, and one reason your team fits. An unanswered item is a useful follow-up question, not an automatic prediction of loss.
Measuring Win Rate Reliably and Using It to Forecast
Keep one row per submitted proposal with its submission date, service type, source, proposed value, outcome, and decision date. Mark unresolved work as pending. At each review, report the resolved cohort's wins and losses alongside the number still open. If a cohort is too small or too recent, show counts and wait for more decisions.
Segment only as far as your data supports. A packaging studio might compare new identity systems with SKU adaptations. A video team might separate repeat-client cutdowns from competitive campaign pitches. Many tiny categories can make the table look precise while leaving almost no proposals in each one.
For planning, you can make a scenario: number of comparable proposals x assumed win probability x average project value. Calclet's revenue calculator methodology describes this calculation. For example, 20 similar proposals at an assumed 25% win rate and an average value of $8,000 give a $40,000 scenario (20 x 0.25 x $8,000). That is an illustration, not booked revenue or a validated forecast. Revisit the assumptions as actual decisions arrive, and keep unresolved opportunities separate from confirmed work.
Tactics to Raise Win Rate Within 30 to 180 Days
Treat the window as three rounds of learning, with room for longer sales cycles:
- Days 1-30: define and baseline. Set the outcome rules, clean up recent proposal records, and note why each opportunity was pursued. Pick one or two comparable groups to watch. If decisions are still open, record that instead of forcing a rate.
- Days 31-90: test a small change. Add a bid/no-bid conversation, ask the buyer to confirm priorities, or make proposal headings follow the stated review criteria. Keep the change visible in your records so you can see which proposals used it. For formal bids, use the buyer's actual submission instructions.
- Days 91-180: compare and revise. Review resolved cohorts with similar sources and project types. Look at proposal count, pending work, time spent preparing bids, and buyer feedback as well as win rate. Keep a useful practice; change one that adds effort without improving clarity.
Before writing a brand proposal, for example, confirm the number of decision-makers and review rounds. In a tender, map every required response to a heading so a reviewer can find it. Price the actual deliverables and assumptions, then have a colleague check the quote. An AI-enabled proposal workflow can help organize a first draft for that review, but the team still decides what to offer and send.
Pro Tip: After a decision, ask for one concrete piece of feedback: a missing requirement, an unclear cost, or a concern about the proposed approach. Record the answer beside the proposal outcome.
How Data-Driven Scoping Supports Higher Win Rates
A clearer project plan gives a buyer a clearer proposal to assess. Start with the brief's deliverables, dependencies, approval points, and unknowns. Then turn them into phases, tasks, roles, and estimated hours. Review the draft against the brief before pricing it. That process can reveal a missing production step or an assumption the client needs to confirm; it does not establish that a tool caused a higher win rate.
For a packaging assignment, list concept work separately from adapting six SKUs and preparing production files. Review who supplies final copy and dielines. Price the hours by role, then review costs, overhead, and target margin behind the quote. If the buyer changes the deliverables, adjust the plan and quote before exporting the proposal.
Roadbase supports the broad brief-to-editable-plan-to-proposal sequence described here. The existing article on how Roadbase handles brief-to-proposal conversion gives further context. The useful discipline is the human review of the draft and assumptions, followed by a proposal the buyer can evaluate.
Common Mistakes When Calculating and Interpreting Win Rate
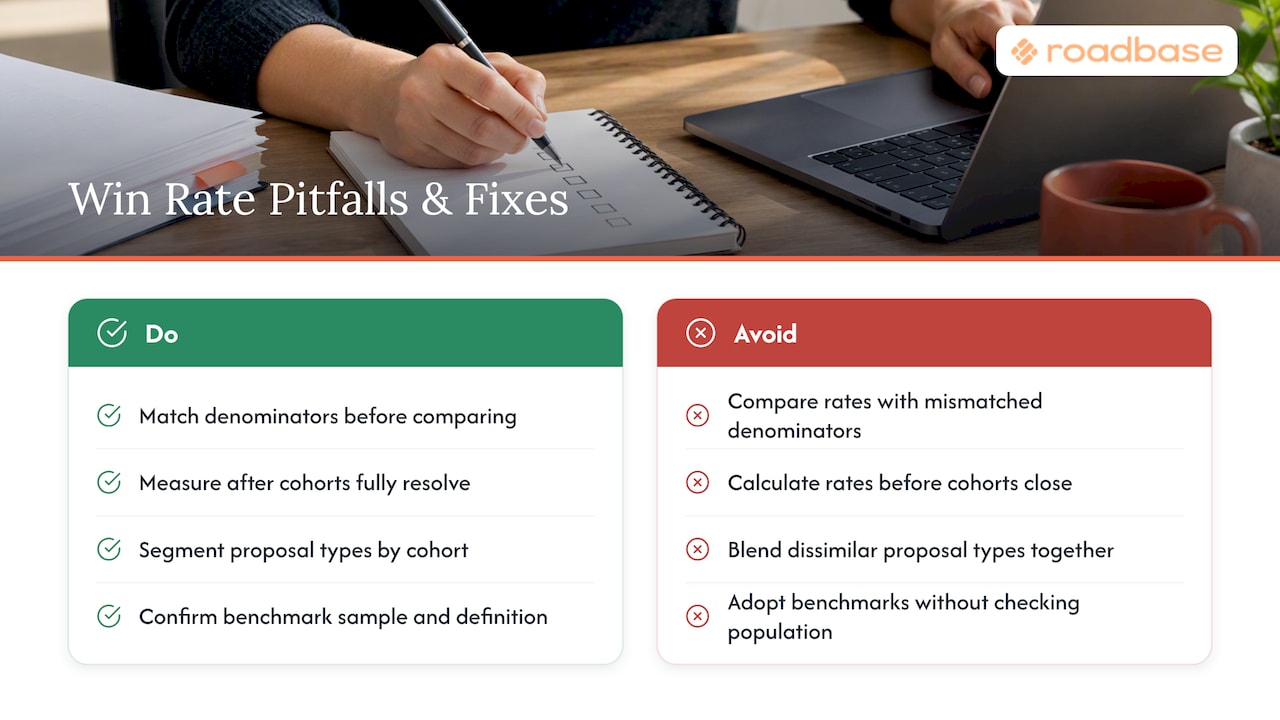
The easiest mistake is changing the denominator without noticing. If one quarter includes no-decisions as losses and the next excludes them, the percentages do not describe the same thing. Write the rule beside the result and keep pending proposals in view.
Another is mixing submission and decision dates. A proposal sent in March may close in May. Comparing March submissions with March wins mixes different groups, especially when some projects take longer to decide.
An overall rate can hide a shift in proposal mix. A studio may send fewer cold RFP responses and more repeat-client quotes. Its overall rate could rise even if nothing about either type of proposal improved. Compare like-for-like groups and show their counts.
Borrowed benchmarks cause a similar problem. A number from enterprise software deals or federal bids may describe a different buyer and decision process. Check the population and stage before treating it as a useful comparison for project-based creative work.
For grant submissions, following the funder's requirements is essential. A client proposal also benefits from answering the actual brief, but grant screening rules are not a measure of creative-service win rates.
Examples of Win Rate Changes and Their Impact
Suppose a small studio sent 20 comparable proposals in one resolved cohort and won four: 4 / 20 = 20%. In a later cohort of 20 comparable proposals, it won six: 6 / 20 = 30%. That ten-point difference is observable, but 20 proposals per group leave plenty of room for chance and differences in buyer mix. Review the individual decisions before crediting a process change.
Now consider a team that puts each evaluation criterion under a matching heading. The buyer can find its answer more easily. If the team's later rate changes, the formatting may be one explanation to explore; the result alone cannot prove it.
Or take a studio that begins asking about budget and approvals before committing to a pitch. It may submit fewer proposals. Its win rate could rise while the number of wins stays flat. Track submissions, wins, and time spent preparing proposals together so the percentage does not hide that tradeoff.
How Industry and Sector Differences Shape Win Rates
Formal federal bids, academic grants, commercial RFPs, and creative-service quotes have different requirements and decision routes. Federal guidance often focuses on qualification and preparation before a bid; grant guidance focuses on a funder's rules and priorities. Those contexts offer useful questions, but neither provides a universal win-rate target for a design studio.
Within creative services, project type and relationship also matter. A repeat client asking for packaging adaptations presents different unknowns from a new prospect seeking an event concept. Keep those contexts visible when you compare outcomes. If an outside report groups unlike work together, use it to ask better questions rather than to grade your team against its headline number.
Tools and Software for Tracking Win Rate
A spreadsheet is enough to start. Record the same fields for every submitted proposal, assign each an outcome, and review resolved cohorts on a regular schedule. If you already use a CRM, it can hold that record too. The key is a shared rule for when a proposal enters the count and when its outcome is final.
Proposal tools can help with drafting and review. A comparison of proposal software built for agencies and freelancers is useful when deciding which features matter to your team. Quoting tools address another part of the work: making deliverables, hours, costs, and assumptions clear before export. The guidance on evaluating proposal automation for small teams can help you frame that choice.
Keep win-rate tracking separate from the claim that any tool improves it. A well-kept spreadsheet can answer the measurement question; a drafting tool can help prepare a proposal. Judge each against the job it actually does.
Where to Look First in Your Own Win-Rate Data
Start where your own records point. If bids often fail the client's requirements, add a brief-based review before submission. If the team spends days on poor-fit opportunities, try written bid/no-bid criteria. If pricing questions recur, make deliverables, assumptions, and role hours easier to inspect. Change one practice at a time, then compare similar resolved proposals and buyer feedback over the next review cycle.
-- Nicolas Robertson
Roadbase Helps You Move From Brief to Reviewed Priced Proposal
Have a real brief, notes, or PDF to turn into a quote? Start a draft plan in Roadbase. Paste the brief or attach the PDF, then review and adjust the editable phases, tasks, roles, and estimated hours. Check the costs, overhead, target margin, and assumptions behind the quote before exporting the reviewed plan and price as a proposal PDF.
That gives you a practical review point before the proposal goes to a client. For current options, check Roadbase pricing. You can also visit Roadbase for the product overview.
FAQ
What is a good bid win rate?
One that you can define and improve within a comparable group of bids. Start with your own resolved outcomes, show the counts, and separate referrals, repeat work, and competitive bids when you have enough examples to compare them.
What is a good win rate percentage?
There is no percentage that fits every proposal type. A useful figure has a stated numerator and denominator, a time period, a proposal count, and a clear treatment of pending and no-decision work.
What is a rate proposal?
A rate proposal sets out the fees or rates for a service, usually alongside the work, deliverables, and assumptions behind the price. It helps a client see what they would pay for and what would require a change to the quote.
What makes a proposal successful?
It answers the buyer's actual requirements, presents a feasible approach, makes the work and price clear, and is easy to review. For grants, the funder's submission rules and priorities are essential; for client work, use the brief and decision criteria the buyer provides.
Sources
- Improving proposal win probability in federal contracting
- Opportunity win rate by stage: formula, benchmarks & stage conversion analysis
- What makes a successful proposal | Stanford Research Development Office