

Agency Profit Margin: How to Calculate It and What Is Healthy
Meta description: Calculate gross and net agency profit margin, compare U.S. digital agency averages by size, and review the costs and choices behind your own result.
Your agency profit margin is the share of revenue left after a defined set of costs. In one U.S. digital-agency study, average after-tax net margin was 13% for 2025, but the figure differed by agency size. This guide shows you how to calculate gross and net margin, compare like with like, and review the costs and decisions behind your own result.
TL;DR
- Gross margin is revenue minus defined direct delivery costs, divided by revenue. After-tax net margin includes overhead, interest and income tax as well.
- Promethean Research reports a 13% average after-tax net margin for U.S. digital agencies in 2025. Its size groups differ, and none is a prescribed target.
- Rates, utilization, project mix and overhead can affect the result. Review them against your own costs, workload and quality needs.
- A quote sets the initial assumptions. Track delivery time and remaining work so you can review them while a project is underway.
Table of Contents
- What agency profit margin means
- How to calculate gross and net margin
- What is a healthy agency profit margin?
- Project margin versus agency margin
- The levers that move your margin
- A quick self-check
- Our perspective
- Where Roadbase fits
- FAQ
- Sources
What agency profit margin means
Profit margin is the percentage of revenue left after you subtract expenses. Which expenses you include determines what the number tells you.
Gross profit margin uses direct delivery costs. For an agency, those may include delivery payroll and benefits, freelancers, contractors, and project-specific tools or licenses. Define how you allocate shared delivery costs before comparing periods. MediaPost's agency-management discussion describes payroll as the largest piece of delivery cost.
Net profit margin includes every expense. That means delivery costs plus rent, sales, administration, interest and income tax for an after-tax measure. Xero's U.S. guide defines net margin using all expenses, including interest and taxes. If an owner does client delivery, include the delivery pay in direct costs under a stated policy; put administrative pay in overhead. Owner draws or distributions are not automatically expenses.
Two practical checks:
- Compare after-tax with after-tax. A pre-tax figure uses a different numerator and may look higher without indicating stronger operations.
- Keep the cost categories and period consistent. If an expense moves between direct costs and overhead, gross margin changes even if after-tax net profit does not.
How to calculate gross and net margin
Use revenue and costs from the same period: a month, a quarter or a year.
- Gross margin = (revenue - defined direct delivery costs) / revenue x 100
- After-tax net margin = (revenue - all expenses, including interest and income tax) / revenue x 100
These follow the formulas in Xero's guide. Here is an illustrative one-year agency example, not a benchmark. Delivery pay is counted in direct costs; owner administrative pay, if any, belongs in overhead. No cost appears in both rows.
| Line | Amount |
|---|---|
| Revenue | $800,000 |
| Direct delivery costs (delivery payroll, contractors, project tools) | $440,000 |
| Gross profit | $360,000 |
| Gross margin | 45% |
| Other operating and overhead costs (rent, admin, sales, non-billable payroll, software) | $230,000 |
| Interest plus income tax | $30,000 |
| After-tax net profit | $100,000 |
| After-tax net margin | 12.5% |
Here, $360,000 / $800,000 gives 45% gross margin. Subtracting $440,000, $230,000 and $30,000 from $800,000 leaves $100,000, or 12.5% after-tax net margin. Gross helps diagnose the stated delivery cost basis; net includes the costs of running the firm.
Margin is not markup
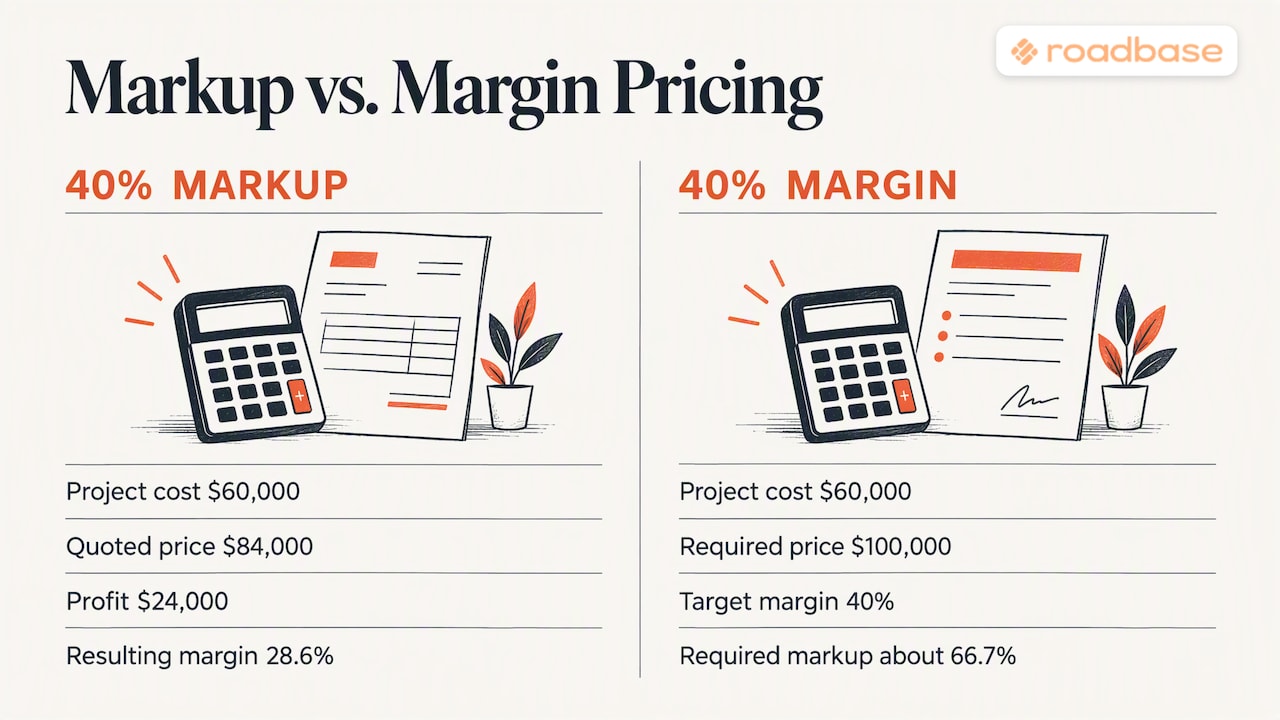
Markup uses cost as its denominator. Margin uses price. Mixing them can lead to a quote that misses the intended modeled margin.
If a project costs $60,000 on your defined cost basis and you add a 40% markup, the price is $84,000. The $24,000 difference is 28.57% of price, so the modeled gross or project margin is about 28.6%. A 40% margin on the same cost calls for a $100,000 price, equivalent to a 66.67% markup. Include any labor, direct expenses or allocated overhead you intend to cover in that cost basis before using a target-price result. Our guide to cost-plus pricing for agencies goes deeper on quote construction.
What is a healthy agency profit margin?
There is no universal healthy percentage. Compare the same kind of margin, year and agency population, then examine your labor policy, business model and resilience. These U.S. digital-agency averages are reference points from Promethean, not targets for an individual firm.
| Benchmark | Figure | Source |
|---|---|---|
| U.S. digital agencies, average after-tax net margin, 2025 | 13% | Promethean Research |
| Same measure in 2024 | 14% | Promethean Research |
| Long-run average since 2015 | about 15% | Promethean Research |
| 0 to 9 FTE, 2025 | 19% | Promethean Research |
| 10 to 24 FTE, 2025 | 12% | Promethean Research |
| 25 to 49 FTE, 2025 | 9% | Promethean Research |
| 50+ FTE, 2025 | 8% | Promethean Research |
A few readings of that table:
- Around 13% is an average, not a goal. Compare it with your own after-tax figure only if the expense definitions are comparable. Optivation's Agency Economics Report brings together agency and broader professional-services data; its project gross figures use another population and should be read separately from this firm net table.
- Specialization is associated with different results. In Promethean's 2024 survey of digital-services leaders, specialized agencies reported net margins 30% higher than generalists, according to its State of Digital Services report. That comparison does not show that narrowing a service line will raise any one firm's margin.
- The small-agency categories differ across reports. Promethean's 2024 industry report found 64% of U.S. digital agencies in its 1 to 10 employee category. That is a different report and group from the 2025 0 to 9 FTE row above.
Benchmarks from another country or sector may use different cost and tax treatment. Check the definition before making the comparison.
Why margin falls as agencies grow
In Promethean's 2025 U.S. digital-agency size groups, average after-tax margin was lower in each larger group. The pattern does not mean size itself caused the difference. More management, coordination and support can add cost, while founder delivery or underpaid owner labor can make a small studio's reported margin look unusually high. A larger agency may also choose infrastructure that supports steadier delivery.
As you add people, review revenue, delivery costs and the support work the team needs. If a bigger team is ahead, scalable team management is useful operational reading while you plan that work.
Project margin versus agency margin
A project gross margin uses that project's revenue and defined direct costs. Firm after-tax net margin uses company revenue and also carries shared overhead, interest and income tax. Improving one modeled project result may help, but it does not by itself determine the firm's net result.
For a packaging-design engagement, compare the quoted hours for concept work, revisions and production files with time actually used. Add direct expenses under the same cost policy. The difference can reveal a pricing or delivery assumption worth reviewing, while the firm-wide measure still has to cover sales, administration and other shared costs.
A simple routine:
- Set a target at the quote. Review roles, hours, direct expenses, overhead treatment and contingency before accepting the proposed price.
- Log actual hours against the estimate. Compare during delivery at a cadence that suits the project, with enough time left to act on an emerging gap.
- Review remaining work. Look at hours used, unfinished deliverables, approvals and expected remaining costs. If assumptions changed, discuss the specific change with the client.
- Review after delivery. Use the recorded difference to inform a later estimate where the work is comparable.
For the mechanics, see our guides on how to track project profitability at a creative agency and project margin for small agencies.
The levers that move your margin
Rates, utilization, project mix, account quality and overhead are possible levers. Their relative importance depends on your own numbers. Payroll is a major delivery cost, as MediaPost notes, but time spent on nonbillable planning, development and quality also has a purpose.
1. Price: rates and pricing model
Promethean's 2024 report described associations between pricing choices and 2023 revenue growth in its digital-services survey: agencies that raised hourly rates grew more than twice as fast as the survey average; agencies that cut rates reported a 13.3% revenue decline; and value-based-pricing users grew 61% faster than average. These figures in the State of Digital Services report do not establish that a pricing choice caused the growth or a margin change.
Review your rate against the time, cost and value of the actual work. A clear package or scope can make tradeoffs easier for a client to discuss, but its effect on margin depends on what delivery takes. Our guides to good, better, best pricing and professional services pricing cover those choices.
2. Utilization: how much of your capacity gets billed
If a designer is paid for a full week and 24 hours are billed, the other 16 hours still need to be funded. They may include planning, training or quality work that the studio values. MediaPost's discussion uses rates and utilization as illustrative ways to examine delivery economics, not universal targets.
Two useful views:
- Separate billable from nonbillable time and look at what each category contains. Our piece on billable vs nonbillable hours shows a 30-day method.
- Compare booked work with realistic availability before adding commitments. See agency capacity planning.
3. Scope: protect the estimate
Unpriced revisions or a changed brief can increase delivery cost on a project. Define phases and included revision rounds, and agree on how a change will be reviewed. Whether the project margin changes depends on the added work, any fee adjustment and the cost basis.
Recorded actual hours give the next quote a more useful starting point than memory alone, especially for similar work. See agency time tracking for quote continuity.
4. Overhead and complexity
Review fixed and shared costs alongside revenue and delivery needs. Software, workspace, sales and management all affect after-tax net margin, even when project gross margin looks sound. A more focused service mix may make estimates easier to compare, but specialization alone does not promise a higher margin.
A quick self-check
Ask yourself these questions about your recent projects and firm accounts:
- Where did actual hours differ materially from the estimate, and why?
- Did the cost basis behind quoted project margin match the one used after delivery?
- Which client accounts combine substantial revenue with weak contribution after direct costs?
- How much time by role went to client delivery, planning, development and other necessary work?
- Can someone else follow the assumptions behind the quote and update them when the brief changes?
The answers point to what to inspect next. An estimating gap, an overhead change and a shift in client mix call for different responses. We outline a repeatable approach in 48 hours to a reliable agency quoting process.
Our perspective
We build quoting software for creative teams. The quote is a useful place to make assumptions visible, and delivery is where those assumptions meet real work. Both deserve attention.
When a brief is messy, roles overlap and revision rounds are uncertain, make the work breakdown and cost basis easy to review. If an assumption changes, update the estimate and discuss the effect on the proposed price. Then compare recorded hours with the estimate while the project is underway.
That comparison can make a later quote more informed when the jobs are similar and the time data is relevant. Use it alongside judgment about the client, scope and team.
If you take one thing from this article, take this: calculate project margin on a stated cost basis, compare it with the quote, and review what changed before pricing similar work again.
Where Roadbase fits
Bring a real brief, notes or PDF into Roadbase and get an editable first draft of phases, tasks, roles and estimated hours. Review and adjust the scope, role costs, rates, overhead, direct expenses, contingency and target margin behind a proposed quote, then export the reviewed plan as a proposal PDF. During delivery, track project or task time against the estimate; relevant history can inform a later draft. The modeled quote margin depends on the inputs you maintain and is different from firm after-tax net margin. Explore the Roadbase pricing page, or start at roadbase.io with a brief you want to turn into a reviewable plan and quote.
FAQ
What is a good net profit margin for an agency?
Promethean's 2025 U.S. digital-agency sample averaged 13% after-tax net margin. Its 0 to 9 FTE group averaged 19%, while the 50+ FTE group averaged 8%. Compare a figure with the same cost, owner-pay and tax definitions; those averages are reference points, not individual targets.
Is owning a marketing agency profitable?
It can be. Promethean reports a 13% average after-tax net margin for the marketing-agency archetype in its 2025 U.S. digital-agency analysis. That is a group average, not a prediction for a particular agency. Its result depends on its revenue and full cost base.
What is the difference between gross and net margin for an agency?
Gross margin subtracts defined direct delivery costs, such as delivery pay, contractors and project tools, from revenue. After-tax net margin subtracts all expenses, including overhead, interest and income tax. They show different views of the same period, so keep owner pay and other cost classifications consistent.
How do I raise my agency profit margin quickly?
First identify what changed: quote assumptions, actual delivery hours, direct expenses, pricing, client mix or overhead. Review current work and remaining costs, then adjust future quotes or discuss a specific scope change where appropriate. Any improvement in firm after-tax net margin depends on the full revenue and expense result.
Sources
- How Profitable are Digital Agencies? | Promethean Research
- Bending, Not Breaking: State of Digital Services 2024 | Promethean Research
- 2024 Digital Agency Industry Report | Promethean Research
- The Agency Economics Report 2026 | Optivation
- Profit margin formula: how to calculate your margins | Xero
- When Running An Agency, What You Measure Matters | MediaPost
- Tips for Scalable Team Management: 2026 Guide